OPEN-ACCESS PEER-REVIEWED
RESEARCH ARTICLE
Daniel Norwood1, Anna Michelson2, Nicole Dunn2, John Duett2, Louis Fleck2, Gyorgy Vas2,3,*
1FNA Pharma Consulting, LLC; 2Trace Organics Analytical Intertek Pharmaceutical Services; 3VasAnalytical.
Reviews in Separation Sciences. Vol.4. No.1. pages e22002 (2022).
Published online 24 March 2022. https://doi.org/10.17145/rss.22.002 | (ISSN 2589-1677).
- Abstract
- Keywords
- 1.0. Introduction
- 2.0 Materials and Methods
- 2.1. Internal standard used for the study
- 2.2. Preparation of the standards solutions for the study
- 2.3. Analytical Instrumentation
- 3.0. Results
- Figures and Tables
- 3.1. Impact of the injection vehicle for the quality of the database
- 4.0. Conclusion
- 6.0 References
*Correspondence:
Vas G. . VasAnalytical, 6 Avalon Ct, Flemington, NJ 08822. USA.
Editor: Moucun Yuan, PPD, Richmond, VA 23230, USA.
Open-access and Copyright:
©2022 Norwood D et al. This article is an open-access article distributed under the terms of the Creative Commons Attribution License (CC-BY) which permits any use, distribution, and reproduction in any medium, provided the original author(s) and source are credited.
Funding/Manuscript writing assistance:
The authors have declared that no funding and writing assistance was utilized in the production of this article.
Competing interest:
The authors are employed by the above-mentioned organizations and have declared that no competing interests exist.
Article history:
Received 31 December 2021, Revised 11 February 2022, Accepted 17 February 2022.
Abstract
Sample introduction in the GC-MS analysis is a relatively complex, multistep process, where usually a liquid sample is introduced to an injector, evaporated, and transferred to the GC column. To achieve reliable quantitation, the process must be well controlled. In the past decade or so, GC-MS based relative responses were evaluated for hundreds of extractables with the benefit of using those relative response factors for quantitation or to create databases to somewhat bridge the existing gap to estimate the amount of non-identified analytes. No data has yet been published indicating how relative responses are impacted by different injection solvents, or when the evaluation level is addressing the sub µg/mL levels. This paper presents data sets for 74 impurities (0.5-5 µg/mL range), with multiple internal standards, using 8 injection vehicles. Based on the presented data, the injection vehicle has a significant impact on the relative response factors, and therefore the quantitative assignment of the impurities.
Keywords
GC-MS, Relative Response Factor, Solvent Impact, Extractables, Leachables.
1.0. Introduction
It is well known, that finished pharmaceutical products and medical devices contain impurities and they can be traced back to various sources related to manufacturing of drug substances, excipients, manufacturing processes including various modes of sterilization, degradation/aging, packaging systems [1-4] and some other unexpected sources [5,6]. In order to confirm that the product is safe for patient use, impurities must be controlled, or in some cases must be eliminated from the finished products [7], and regulatory authorities require control of impurities at different levels related to the associated risk [7-10].
While drug substance-related impurities are usually well-characterized, structurally evaluated, properly risk-assessed, and available as reference materials for phase-appropriate analytical studies (method validation) and quantitation [11,12], impurities from other sources represent a wide range of chemical entities with limited availability of reference standard materials. Packaging-related impurities are not an exception to this general phenomenon. As packaging systems are diverse, the materials of construction include multiple types of polymeric materials. In addition to the base polymer, they often contain antioxidants, processing aids, UV blockers, colorants (or inks), and labels often containing some type of adhesive matrix. The combination of materials and their degradation products leads to a potential matrix of thousands of potential impurities [13,14]. Low concentration evaluation level and high number of potential impurities require testing approaches beyond standard pharmaceutical practices and yet the safety assessment of the finished products requires reliable and scientifically solid and justifiable quantitation of those analytes [15]. When a packaging system is evaluated by the analytical laboratory, circumstances are far from ideal for the aspects of quantitation, as the number and level of the chemical species are not known in advance, meaning that the analysis is being performed in a ”screening-type” testing manner [15]. Considering those factors point to an “almost impossible” assignment, some scientific-based assumptions must be used for the quantitation approach. In that scenario, the laboratory accepts a level of uncertainty related to quantitation, and the regulators understand and accept the associated error. The practical assumption, in that case, is the analytes of interest have “universal” response under conditions of detection, meaning they would provide the same (or highly similar) response at a single concentration, and if calibration curves are generated for multiple analytes, the slopes of the curves would be identical. In that hypothetical scenario, a single surrogate analyte at a single calibration level would be enough to accurately quantitate all observed analytes [15]. Unfortunately, no such analytical system has been developed and implemented into laboratory practice, therefore, this approach cannot be used. However, a set of data for multiple analytes with multiple calibration curves should be created by the laboratory, and a database for practical use can be created based on those responses. As the entities of the database cover a wide range of chemical species, in a large number, a database of such can be used to estimate the response of a non-identified chromatographic peak within a known and calculated error [16,17]. It is understandable that creating such a database requires significant effort and associated resources. Based on the author’s knowledge, the EU operations of Nelson Laboratories (Leuven, Belgium), pioneered to create such a database, and as of today own the largest one amongst the analytical laboratories [18]. The validity of using those databases for quantitative assessment has been published in the past few years covering multiple analytical techniques and defining the parameters of practical use [19].
It is generally accepted that the peak responses in GC-MS associated with electron ionization are well controlled; and theoretically only depend on the analyte itself, if other parts of the system are well maintained and not contributing factors. Again, this assumption is over-simplifying the analysis process and reducing or ignoring the potential analytical variability from the different analysis steps. The GC-MS analysis process is a multiple-step procedure including, sample injection, sample transfer, separation, and detection. The GC injector seems a simple low-complexity system (a heated tube with gas inlets and outlets), however, the impact of the sample solvent has not been studied in-depth related to testing for extractables and leachables [20]. It was published decades ago, that the injection system can influence the quality of the analytical results [21,22], and different injector solutions have different levels of “discriminative effect” for the injected analytes. PTV (programmable temperature vaporization) injection considered the least discriminative injection technique for wide range of analytes, however the small volume of the inlet liner required for optimum injection performance, can be a challenge in some situations [23,24].
It is widely accepted that the variability related to ionization and detection of GC-MS amenable analytes is much smaller than for the various atmospheric-based ionization processes. It is important to be aware that different detection systems such as quadrupole, ToF or Orbitrap based may provide different spectral information even in GC-MS with electron ionization [19,25].
Besides the injection hardware, the injection solvent (injection vehicle) plays a significant role in the injection process. The nature of the GC-MS analysis requires effective evaporation of the injected liquid sample as separation takes places between a liquid phase (most commonly siloxane) and gas phase. An ideal injection vehicle has no interaction with the target analytes, has a low expansion volume, and preferably has a low boiling point, or at least a boiling point about 50-100 °C lower compared to the 1st eluting chromatographic peak. A solvent ideal for all the potential analytes, unfortunately, has not yet been discovered, however, some solvents behave close to the “ideal requirements” for wide range of analytes. Some of the solvents -usually with polar nature, such as alcohols, and water- are not ideal for GC-injection however they have been commonly used for E&L studies [21,26].
Multiple papers have been published in relation to the nature and the generation of response factor databases, providing data of the applied concentration range, injection vehicle, and the technique of injection.
One of the 1st papers focused on this topic was published by Jenke and Odufu [27] in 2012. The authors presented data for 38 common extractables and 8 surrogate internal standards prepared and injected in methylene-chloride in a range of 5-100 µg/mL. The solutions were injected to a GC-MS system equipped with a HSS (hot split/splitless) injection system maintained at 280°C, evaluating four or more replicate injections.
Zdravkovic et al. published a paper related to a response factor database, using acetophenone-d5 as an internal standard (IS) and 154 common extractables. The evaluation level was 10 µg/mL for the IS and the target analytes in ethyl-acetate injection vehicle. Multiple single quadrupole systems with similar or very comparable system configurations were used for the study. The injection method and the injection temperature for the study were not provided [28].
One of the most recent papers was published by Jordi and colleagues [19]. In this paper, 217 different analytes were evaluated using different analytical techniques including GC-MS and LC-MS based methods. The samples for the GC-MS evaluation were prepared using methylene chloride injection solvent in a 5-25 µg/mL concentration range. For the analysis, a single quadrupole GC-MS system was used. No detailed information was available for the injection method or injection temperature in the referenced paper.
The most detailed and comprehensive database was created by the European Operations of Nelson Laboratories (Leuven, Belgium) [15]. The database contains more than 3,000 entries as GC-MS records [18]. The database was generated using a single quadrupole GC-MS system a single IS of 2-fluorobiphenyl at a 10.0 µg/mL concentration level and the standards were injected in a 20-50 µg/mL range, using methylene chloride injection vehicle. Single injections were performed on multiple systems. The injection method and the injection temperature were not published in the paper [15].
One aspect common to all the referenced studies is utilization of a single injection vehicle within each single laboratory for generation of their respective databases. However, the chemical characterization process of polymeric materials requires multiple extraction solvents [2,9,10], and if multiple extraction solvents are used for the extraction studies, it is obvious that multiple solvents will be injected to the analytical systems. The other common feature of those databases is the amount of the analytes injected on column is in the 5-100 ng range, which is not a challenging level from the detection point of view. At the time when the generation of those database records was started, the industry was focused on inhalation-based products [10], which typically have a large number of doses in a single container configuration and besides the highest risk associated SCT (safety concern threshold) of 0.15 µg /day, the AET (analytical evaluation threshold) is in the µg/mL level. However the industry slowly moved to evaluation of different products with large doses, where even for the extractable studies the AET is at sub-µg/mL levels, sometimes even at single-digit ng/mL levels, therefore the injected analyte is in a pg amount (even after significant level of extract concentration is being performed). It is important to understand if the amount of the injected standard (obviously if it is detected), has any impact for the relative response, and how it can be addressed.
This paper focuses on presentation of analytical data, of relative responses, using four different IS analytes, eight different injection vehicles at 3 different concentrations from 0.5-5.0 µg/mL (0.25-2.5 ng on column) for understanding practical limitations of databases for quantitative purposes. The generated data provide evidence that in some cases the injection solvent has a significant impact on the relative response of the analyte, and therefore the quantitative assessment based on the library records has some limitations, requiring additional studies.
2.0 Materials and Methods
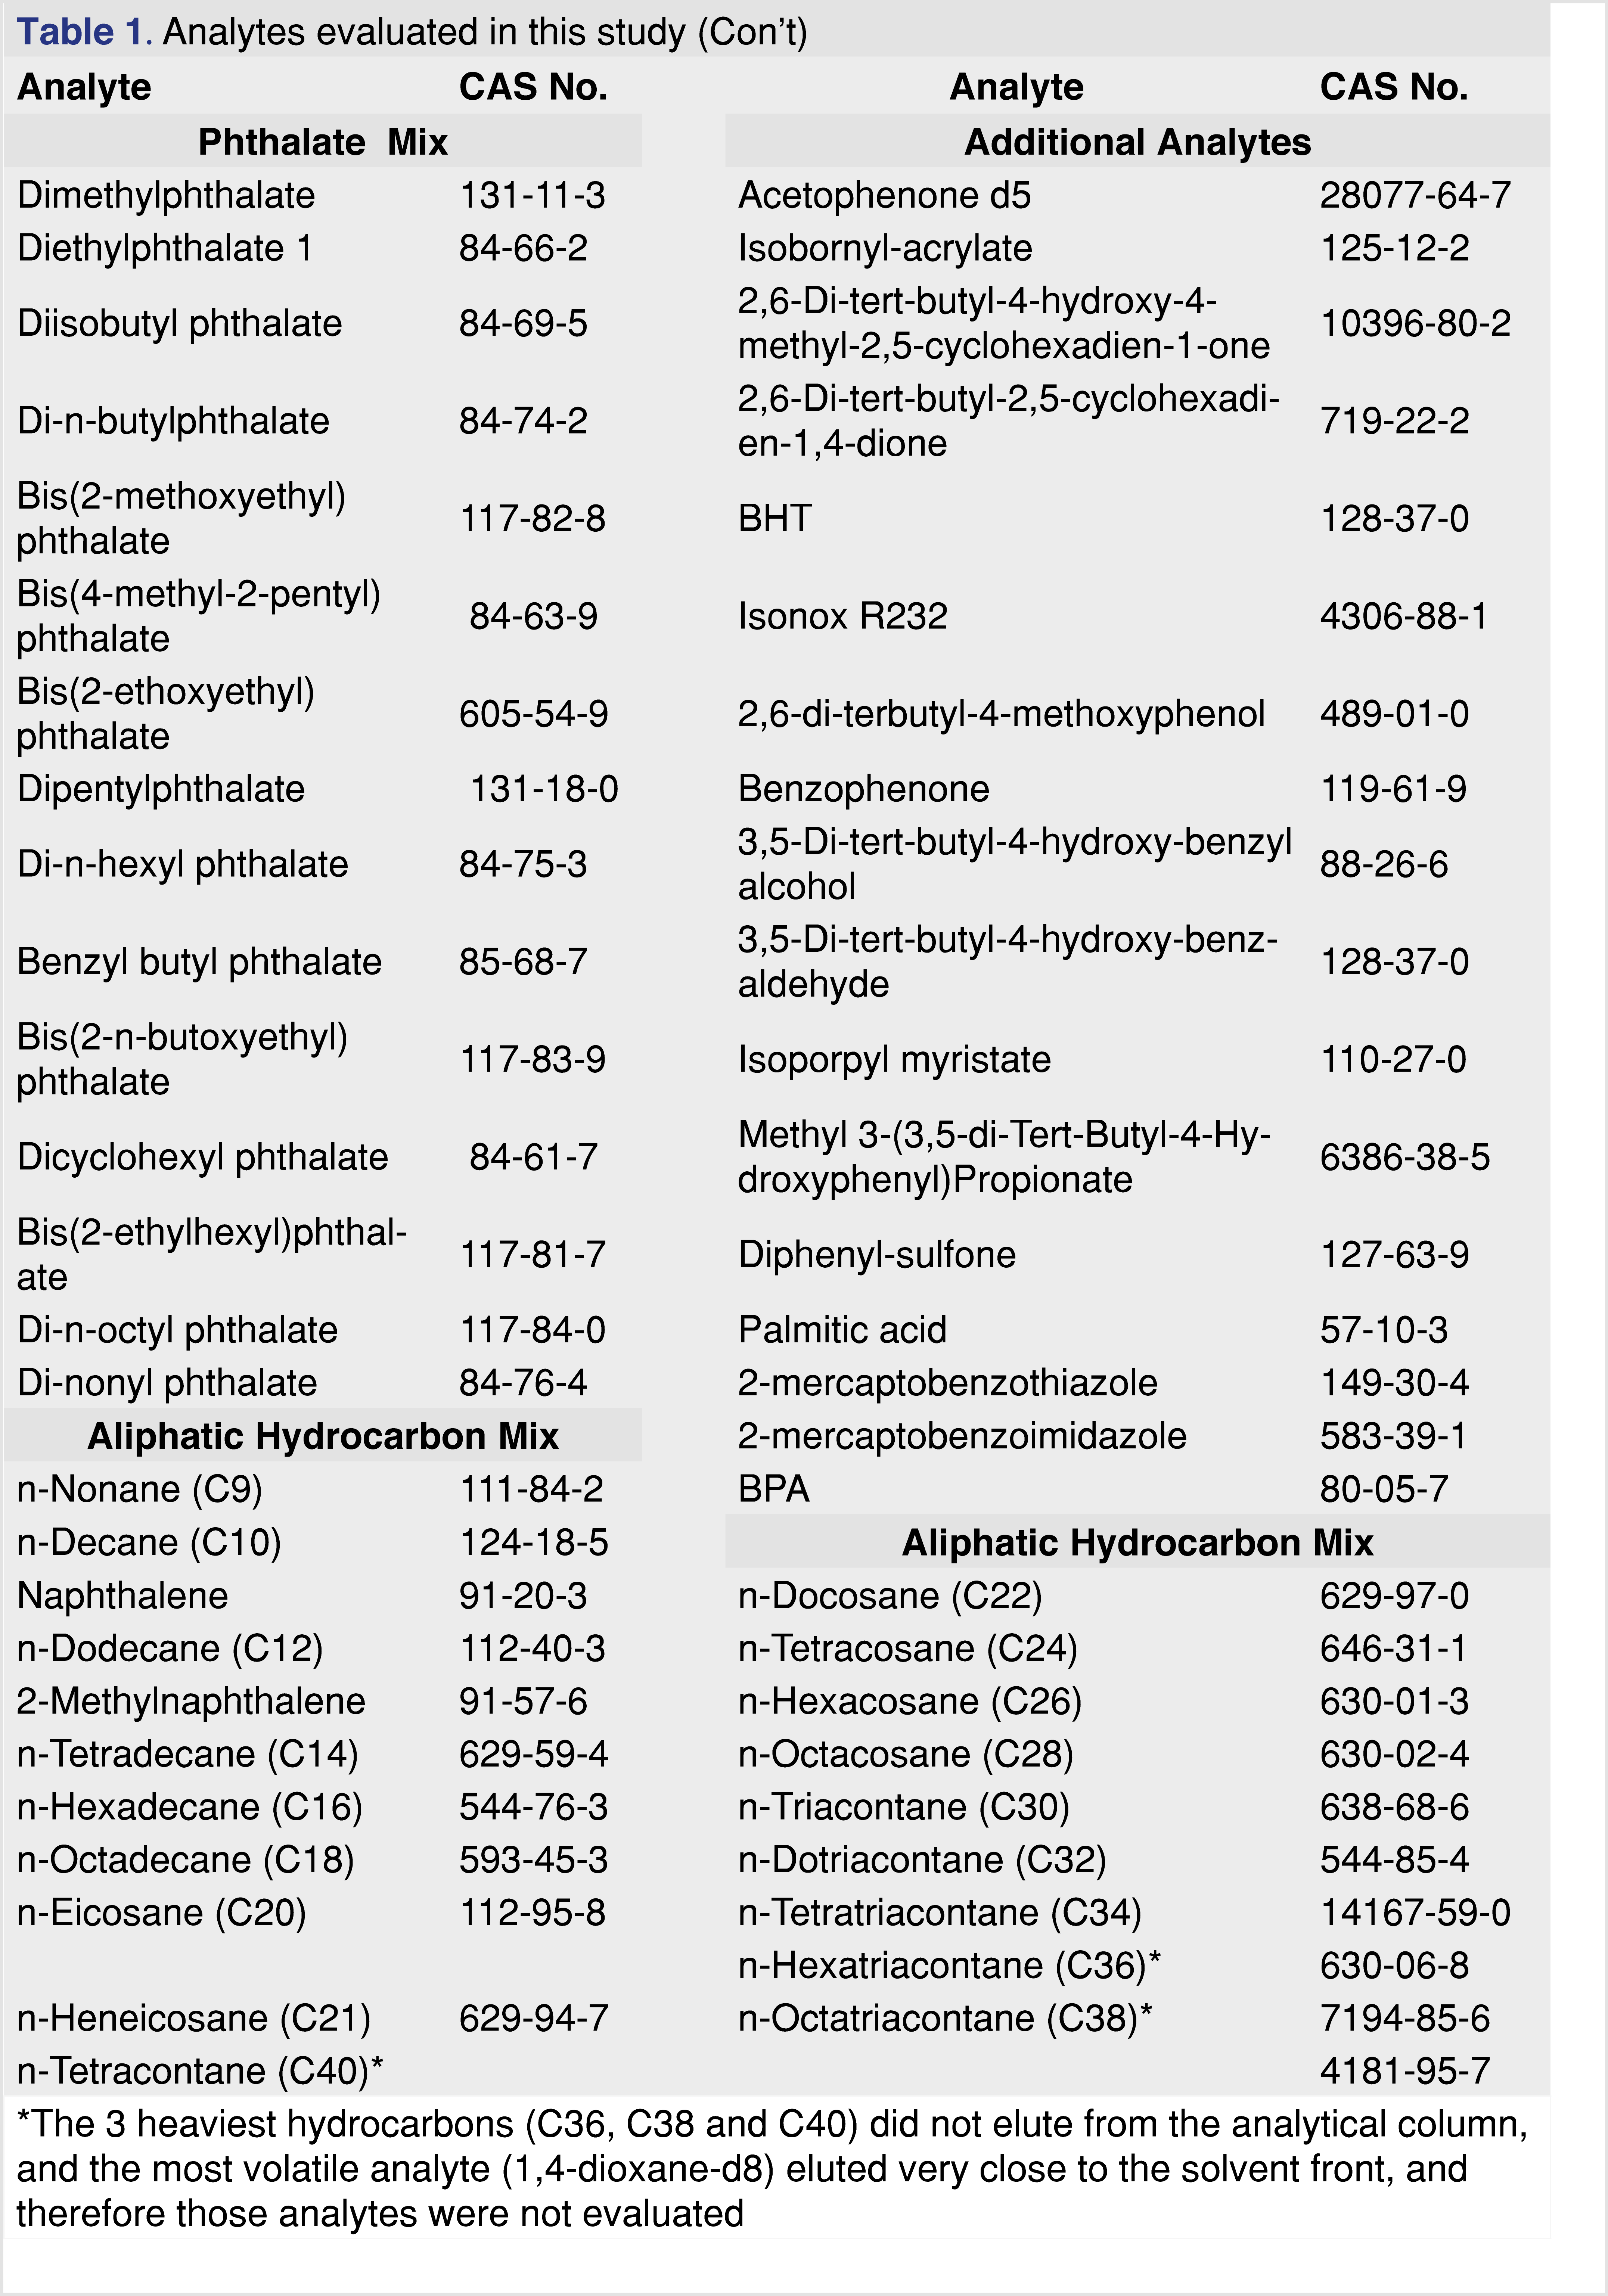
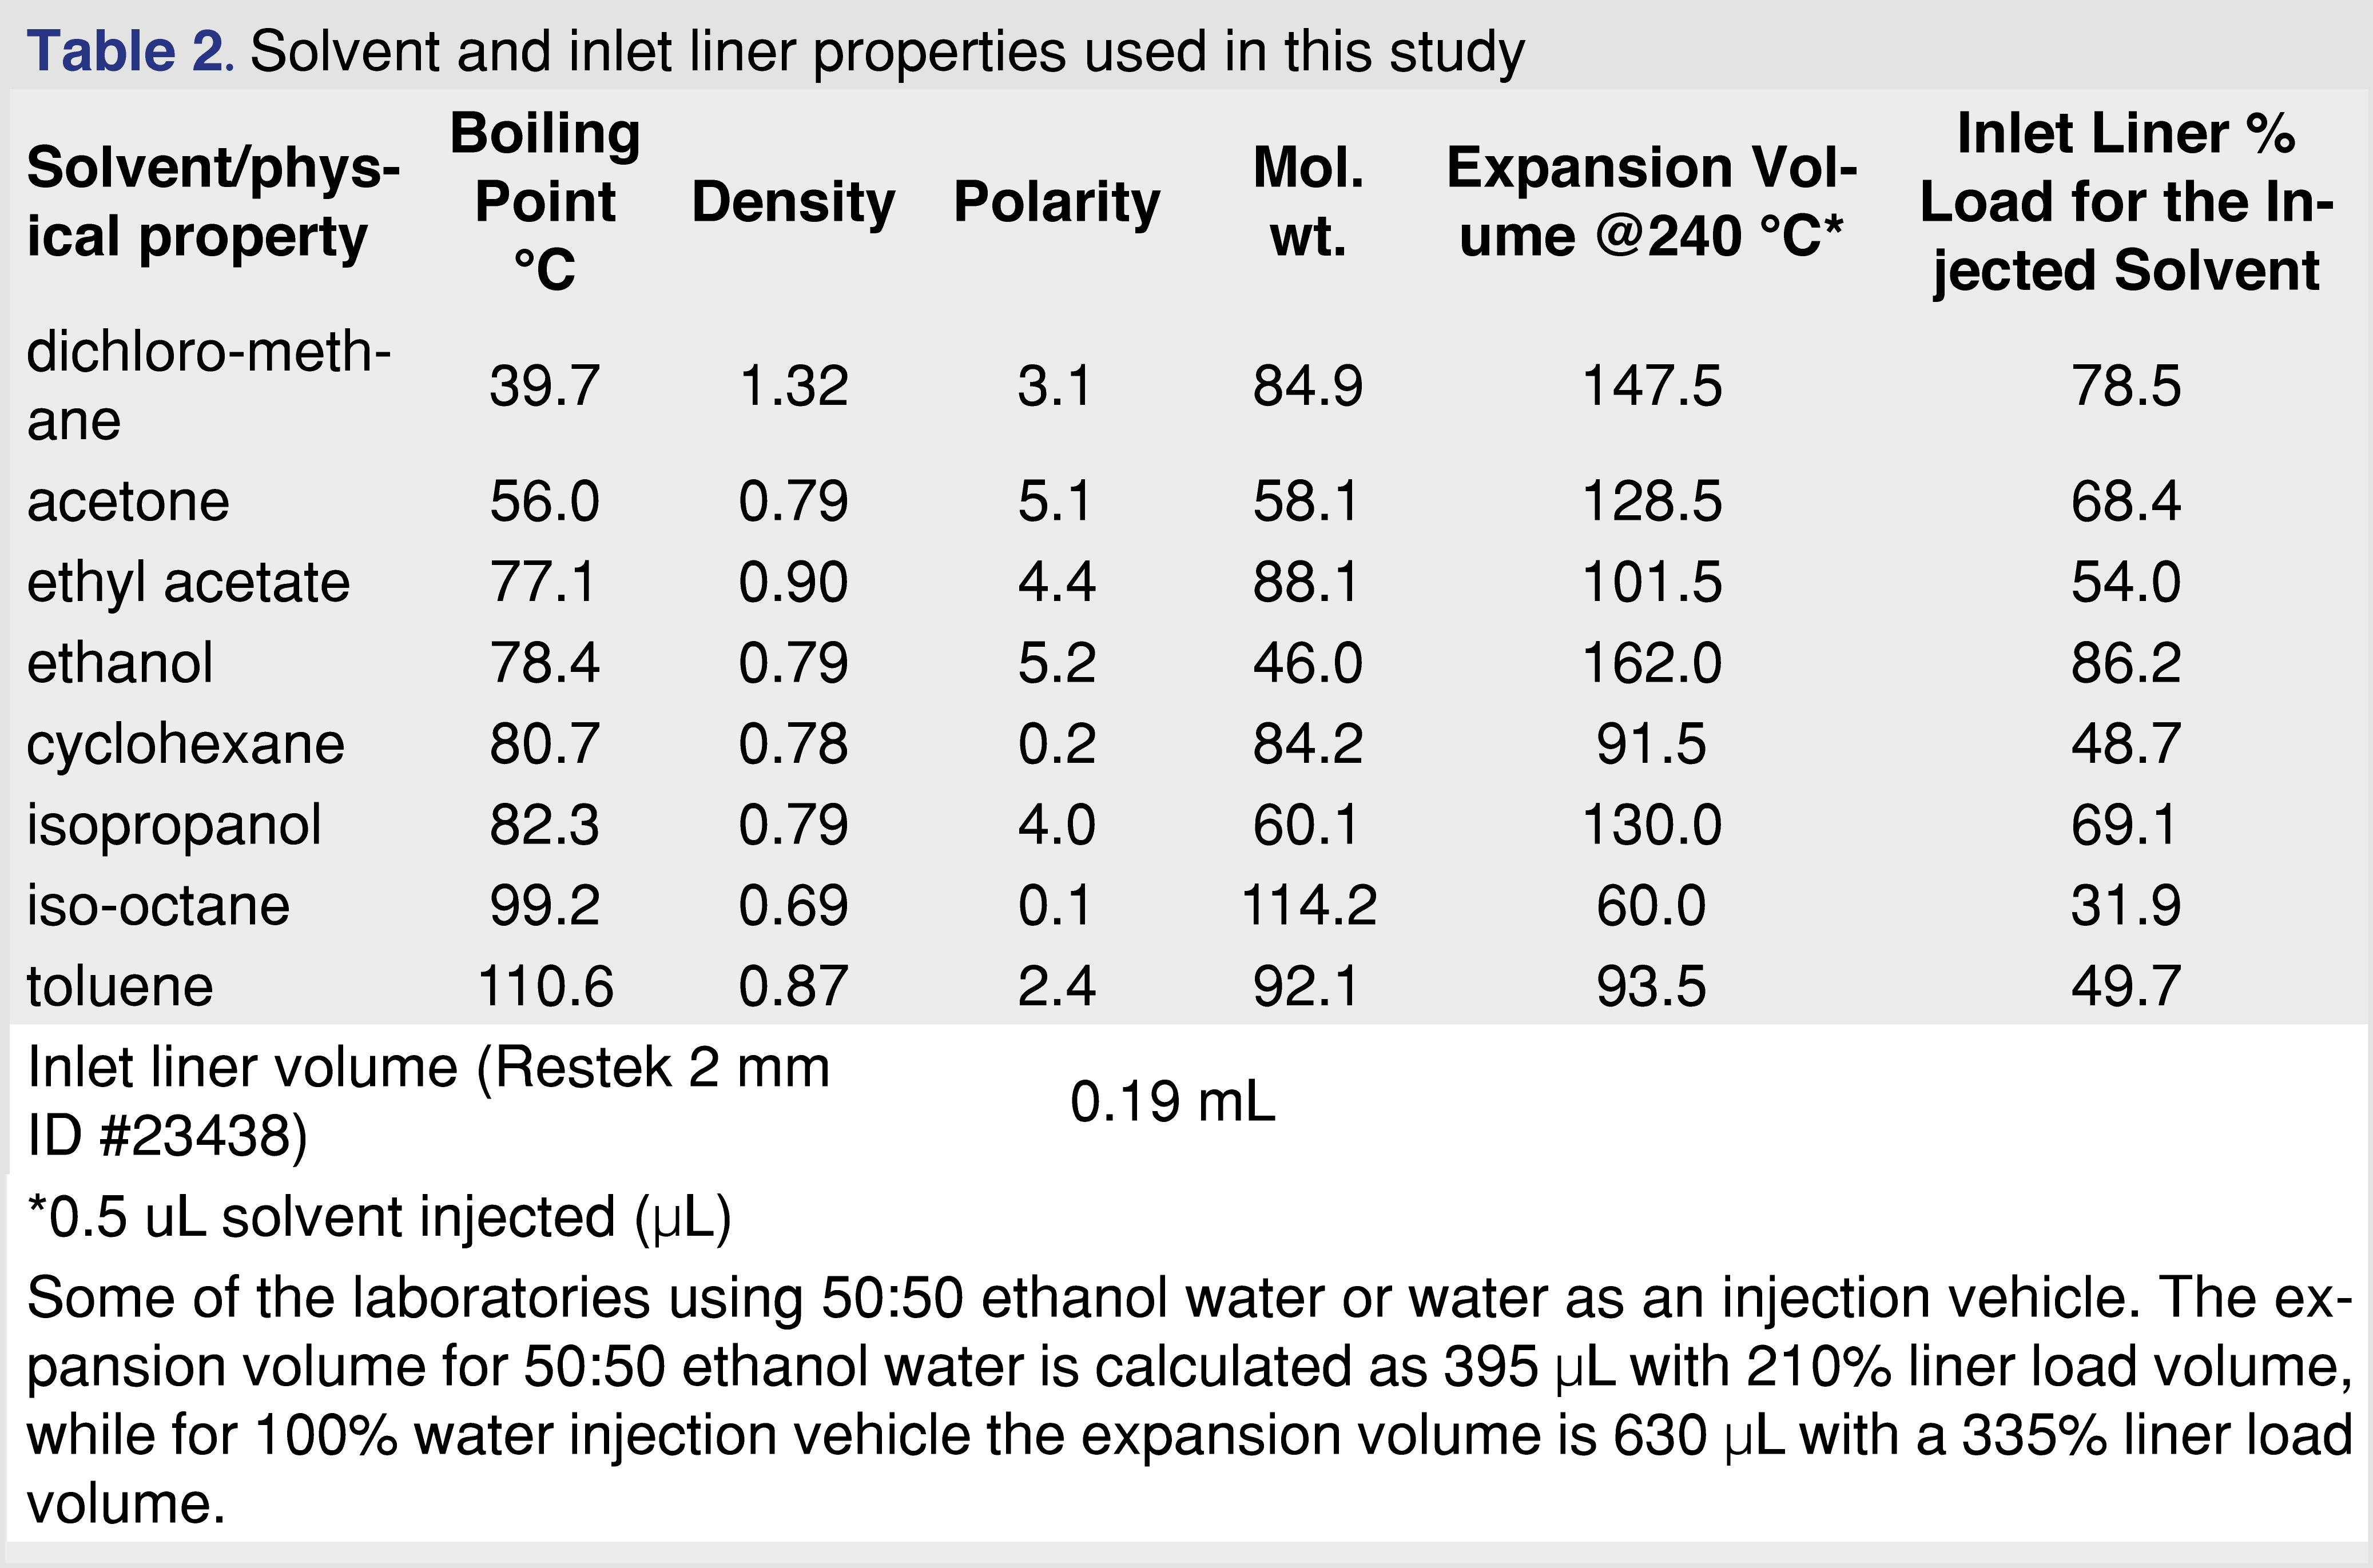
Chemicals of common extractables were purchased either as individual chemicals or as pre-prepared, certified mixtures from Millipore-Sigma (St. Louis, Mo US) or Restek Corporation (Bellefonte, PA, US). The list of the chemicals with their CAS numbers used in the study are listed in Table 1. The combined mixture of the analytes contained 78 analytes plus 4 Internal standards. The GC injection vehicle solvents included 2,2,4-trimethyl-pentane (isooctane), methylene-chloride (DCM), cyclohexane (chex), ethyl-acetate (etac), dimethyl-ketone (acetone acet), toluene (tol), 2-propanol (isopropanol or IPA) and ethanol (etoh) and were purchased with the highest available purity (trace or pesticide grade) from Millipore-Sigma. Solvent details presented in Table 2. The water and the ethanol:water 50:50 (v/v%) solvents were not used in the study, however, the expansion volume calculations are presented in a footnote for comparison to the evaluated solvents.
2.1. Internal standard used for the study
A multicomponent mixture-EPA base—neutral- which consisted of 4 different analytes was included to address different chemical nature, chromatographic retention, and chromatographic behavior. The d5-nitrobenzene provides low response (compared to the other IS chemicals in the mixture) and is relatively polar and eluting early, the 2 fluoro-biphenyl elutes at the middle of the chromatogram and the d10-pyrene and the d14-terpenyl eluting in the latter portion of the chromatogram. The internal standard was applied to compensate for variation of the injection process, and the extracted analytes were processed against the average response of the spiked IS analytes. The internal standard was also used to calculate the relative responses of each individual standard analyte. The internal standard was spiked to each standard solution at 5 µg/mL (5 ppm).
2.2. Preparation of the standards solutions for the study
Individual standards or pre-prepared certified solutions were used and a stock solution was prepared at 100 µg/mL for each individual solvent vehicle listed in Table 2. The stocks were further diluted to 5, 2, and 0.5 µg/mL level with each solvent vehicle and spiked individually with the IS at a concentration of 5 µg/mL. Altogether 24 different solutions were prepared for the study, and all the solutions were injected with 6 replicates (144 injections in total).
2.3. Analytical Instrumentation
2.3.1. GC-MS conditions
Sample extracts were analyzed with GC-MS, using a Thermo Scientific TSQ-9000® triple quadrupole system with a 1310 GC module. It was equipped with a PTV injection system, which was used in a programmed temperature splitless mode at 40°C to 275°C with a 10°C/sec heating time and 0.75 min splitless time. For the chromatographic separation, a Restek Rxi 5Sil MS (cross bonded 5% 1,4-bis(dimethylsiloxy)phenylene 95% dimethyl polysiloxane) 40 m x 0.18 mm with 0.18 µm film thickness (Cat no. 43605) column (β=250) with helium carrier (Ultra High Purity, less than 1 ppm total impurities) at 1.1 mL/min constant flow was used. The oven temperature program was 50°C (1 minute hold) to 325°C at 10°C /min (3 minute hold). Electron ionization (EI) at 70 eV energy with 50 µA current with an ExtractaBrite™ ion source operated at 275 °C was used. A 10 µL gas-tight syringe was used to deliver 0.5 µL injection volume of sample to the system for analysis. The low injection volume was selected to minimize the effect of the solvent expansion volume, where the expanded solvent volumes do not reach the 80% of the liner (only ethanol went slightly above) volume capacity, and still deliver sufficient amount of analyte for detection purposes (0.5 µg/mL solution with a 0.5 µL injection volume resulting in 250 pg of analyte on-column). In order to achieve the benefits of the PTV injection (narrow chromatographic peaks, low boiling point discrimination, effective analyte transfer), the technique requires low volume liners. Injection liners for PTV injection (depending on the inlet hardware configuration), have an internal volume in a range of 0.05-0.22 mL. In our study, as we used multiple solvents for injection we had selected an inlet liner of the upper volume end for this configuration.
The GC inlet liner and the inlet septa were replaced after evaluation of each solvent to be confident that the potential issues related to the inertness of the injection path are addressed, and their contribution to the study outcome is minimized.
3.0. Results
The most common practice for generating a relative response factor for a target analytes, were presented in papers [19,27,28] and talks [29] is to use a single IS at a single evaluation level, along with relative response factor (RRF) database entries generated at the same or similar concentration as the IS or in a concentration range around the IS concentration [27]. The single publication which analyzed a range of concentrations used a 10-40 ppm IS level, which provides excellent peak response free of interference from the analytical system. Analytes for database entries are also injected around that level, with the relative response for the analyte calculated based on the equation presented below [28,30].
Equation 1. Definition of the relative response factor [28,30].
The analytes for the study were selected to cover a boiling point range of 151°C (C9) to 482°C (C34), and a polarity -expressed as logP- from 1.5 (phenol) to 18.2 (C34), and included components with different functional groups (nitro, aromatic alcohol, aromatic ketone, acid, aldehyde, ester), and multiple heteroatoms such as Cl, S, N, Br, F, as those analytes are well known to be sensitive for the injection parameters. As is described in the instrumental section, the PTV inlet liner was replaced after injections for each solvent vehicle to avoid formation of residues in the injector system. In the injection sequence within the same injection vehicle, the injection was performed from the lowest concentration of samples to the highest concentration samples to minimize the risk of carryover. Altogether 1,332 data points were generated for each solvent (74 analytes x 3 concentration levels x 6 replicate analysis). Table 2 in the experimental section details notable differences between the properties of the different injection vehicles. The boiling point of the vehicles covers a range of 39.7-110.6°C and the solvent expansion volume varied between 60-162 µL, therefore differences between the solvents are expected. The injection %RSD was evaluated for the 2-flurobiphenyl (2-FBP) IS and it was in the range of 5.8%-15.1% for the various solvent vehicles. As it is a most commonly used GC-MS injection solvent used by E&L testing laboratories, it was not surprising that the % RSD for methylene chloride was the lowest (lowest boiling point solvent in the study), however, it was not expected that the injection %RSD was the highest for ethyl-acetate solvent vehicle. The %RSD of the retention time of the 2-FBP was in a range of 0.01-0.03%, which translates to a less than 1 sec shift between the 8 different solvents, therefore we can conclude that the various solvents have virtually no impact on the retention time of the analytes.
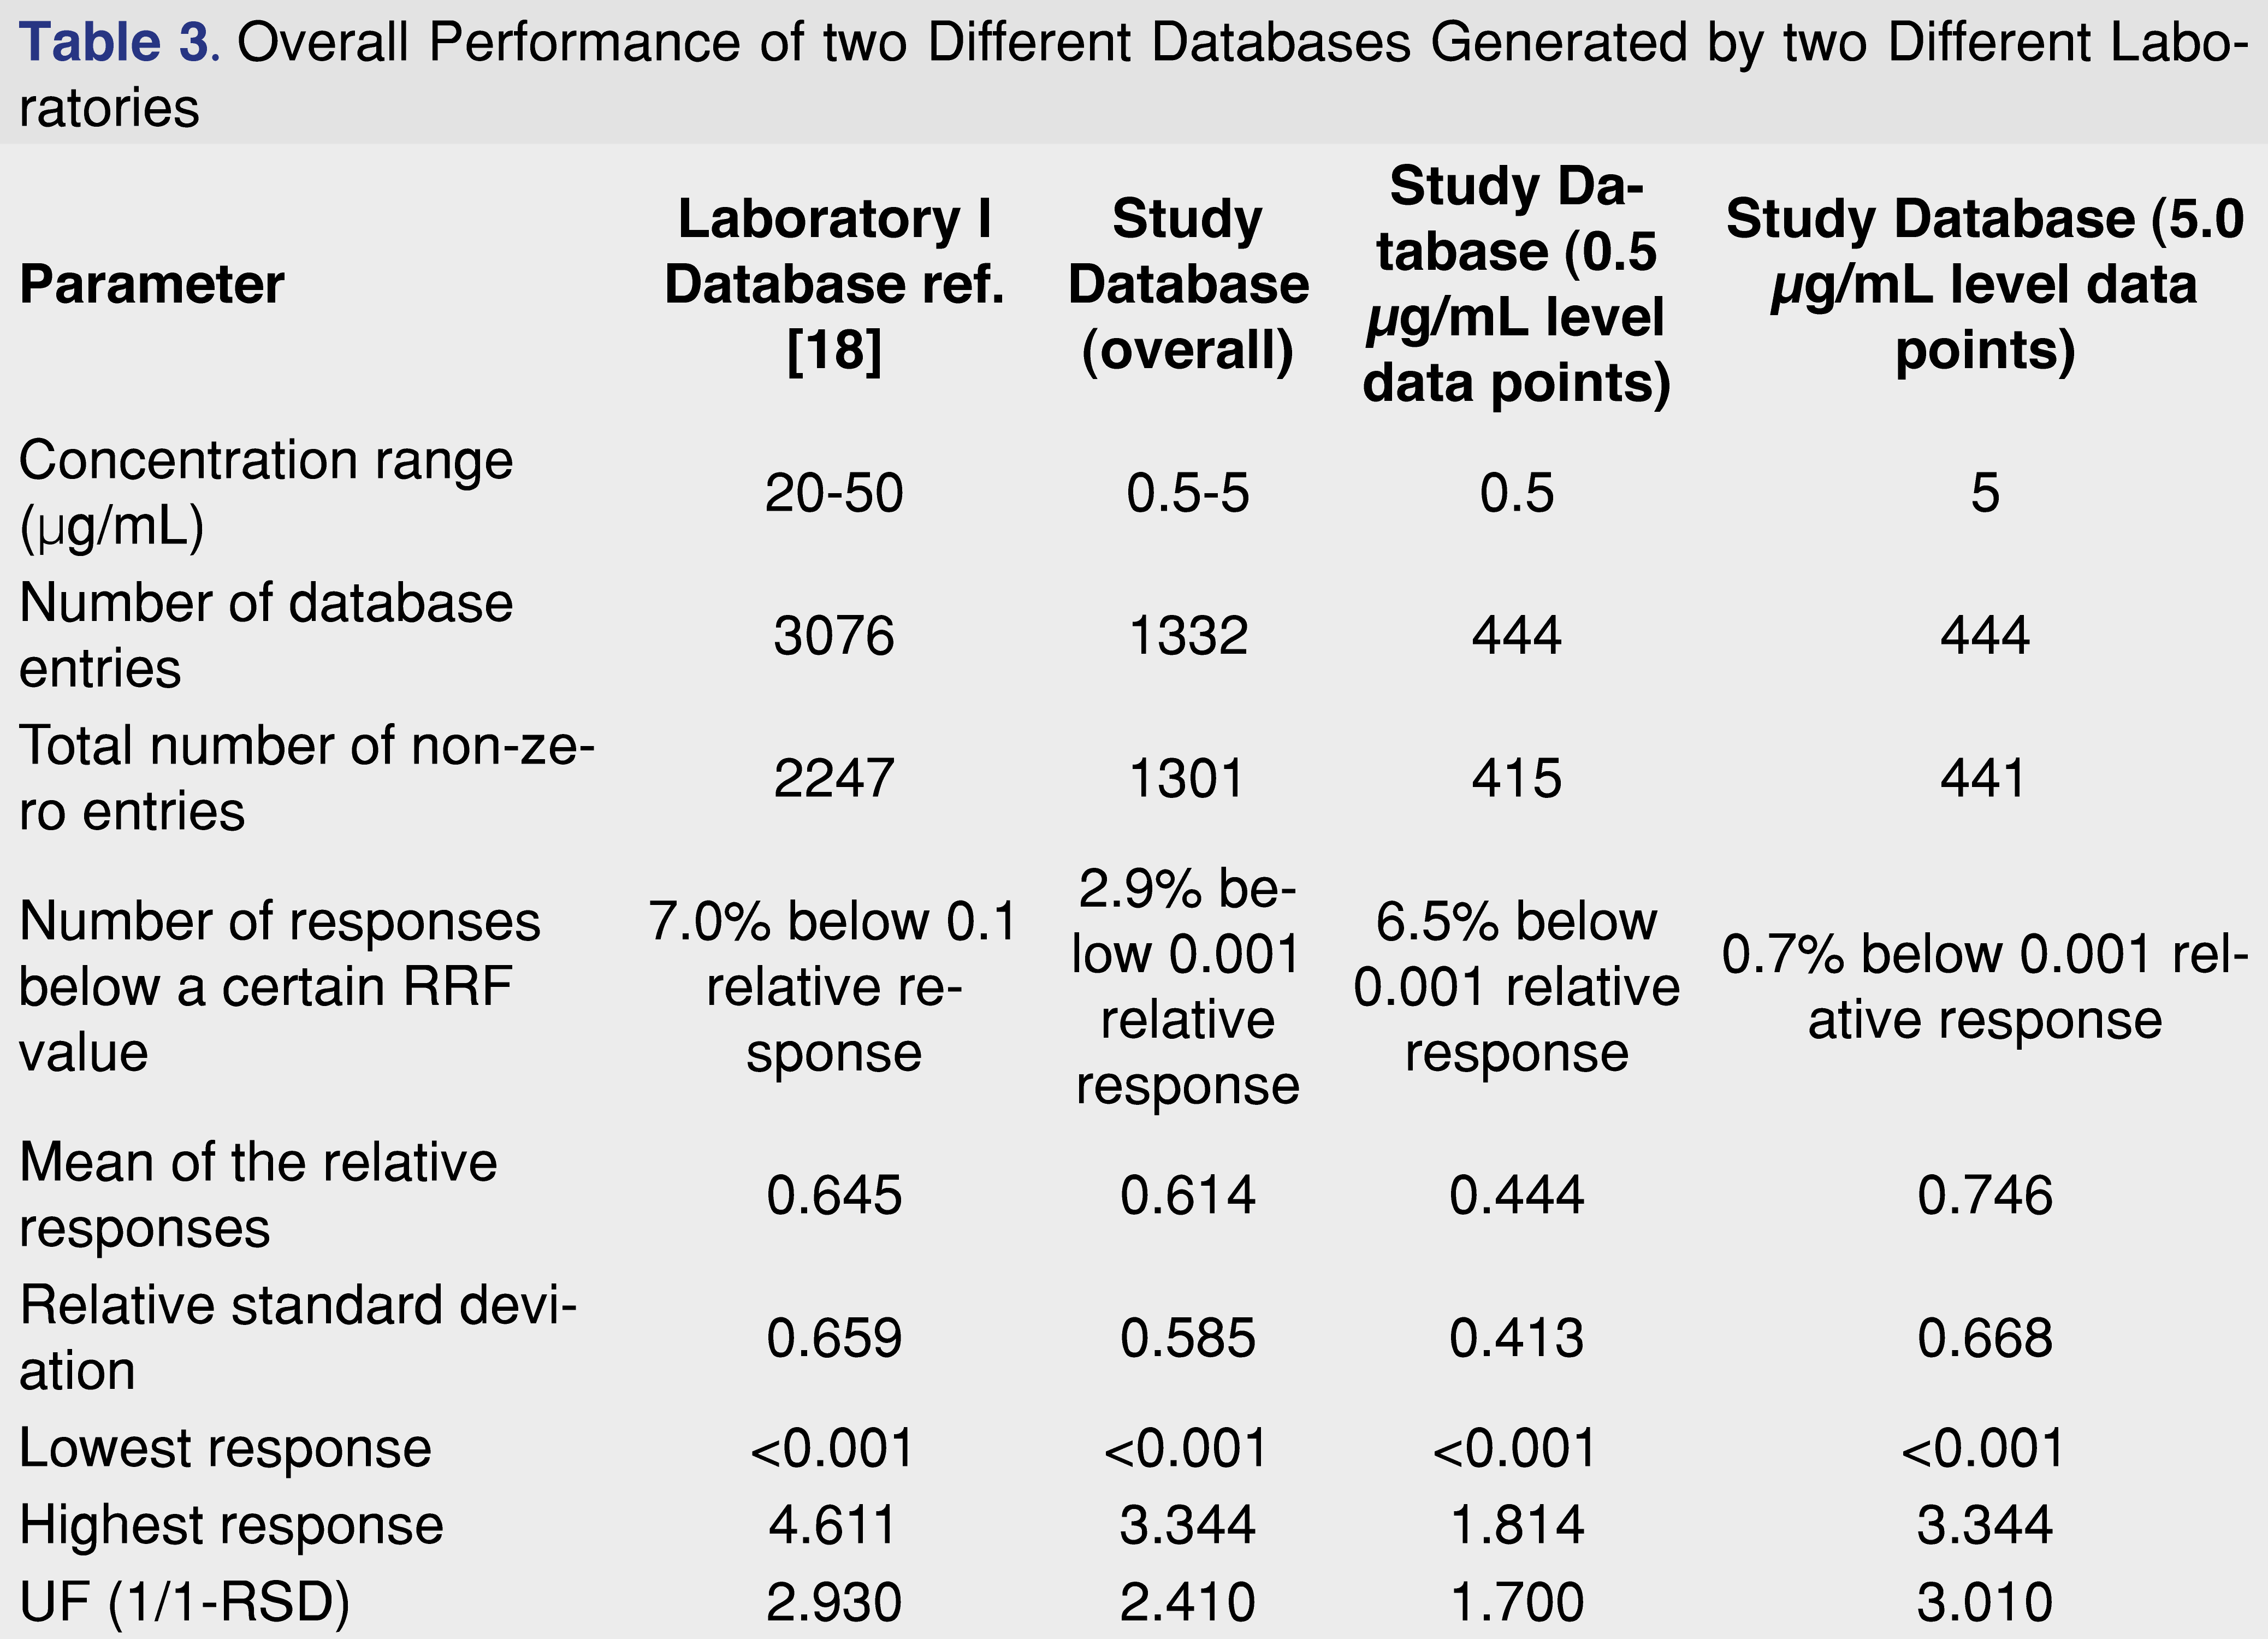
If we compare the average relative responses for the methylene chloride injection vehicle generated by two different laboratories, assuming a partial overlap of the studied analytes, we can see that the overall “performance” of the databases are very similar, even when databases were created using different concentration levels. The evaluation of the two different databases is presented in Table 3.
Besides the “similar” overall database characteristic between the two presented databases, the analysis of the database records at the 0.5 µg/mL evaluation level shows a different picture. The mean of the relative responses is 27% lower than the overall mean responses, and the percentage of the low responding database records is 6.5% compared to the overall 2.9%. The increasing number for the low responding database entries indicates that the detection system reached the detection capability, analytes which provided higher relative responses at the 2 and 5 ppm concentration level. If the overall relative response is lower at the lower concentration level, and the number of low responding entries are elevating compared to the higher concentration injections, the laboratory may need to consider to generate and using database responses at low concentration, when low concentration level samples are being analyzed. This additional level of entries may be required for more accurate quantitative assessment, and the database records need to be extended to include lower concentration ranges.
A hypothetical situation for a leachable assessment is presented below, where different relative response for three different identified packaging-related impurities resulting different safety assessment requirements based on the different RRF values determined at different concentration level (Table 4). The study AET was identified at a 250 ng/mL level, therefore in the 1st case the relative response determined at 0.5µµg/mL level is being used, while in the other example the relative response for 5 µg/mL level was used. In the first case when a relative response determined at a level close to the AET is used, the calculation resulted in 500 ng/mL calculated levels for all three analytes (at or close to the theoretical values), therefore those analytes will be evaluated properly, and the toxicological risk assessment will be appropriate. Further action may include analytical method validation for those leachables present above the AET of the study. In the second case, a relative response determined at a higher level was used, and the quantitative estimation resulted in levels below the AET, therefore no further action would be recommended. According to a recently published paper by Jenke et al. quantitation errors of this type should be avoided in the safety risk assessment process [16]. This simple example highlights the importance of database entries generation and curation for quantitative purposes. The authors understand that it is nearly impossible to address every possible scenario when a database is being generated, however, it is important that the laboratory use good scientific judgment when they evaluate the finished product and do not use a “one size fits all” approach for every evaluation.
Figures and Tables


[Click to enlarge]
3.1. Impact of the injection vehicle for the quality of the database
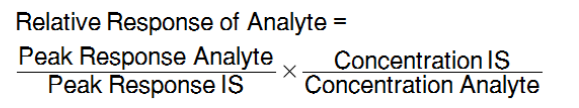
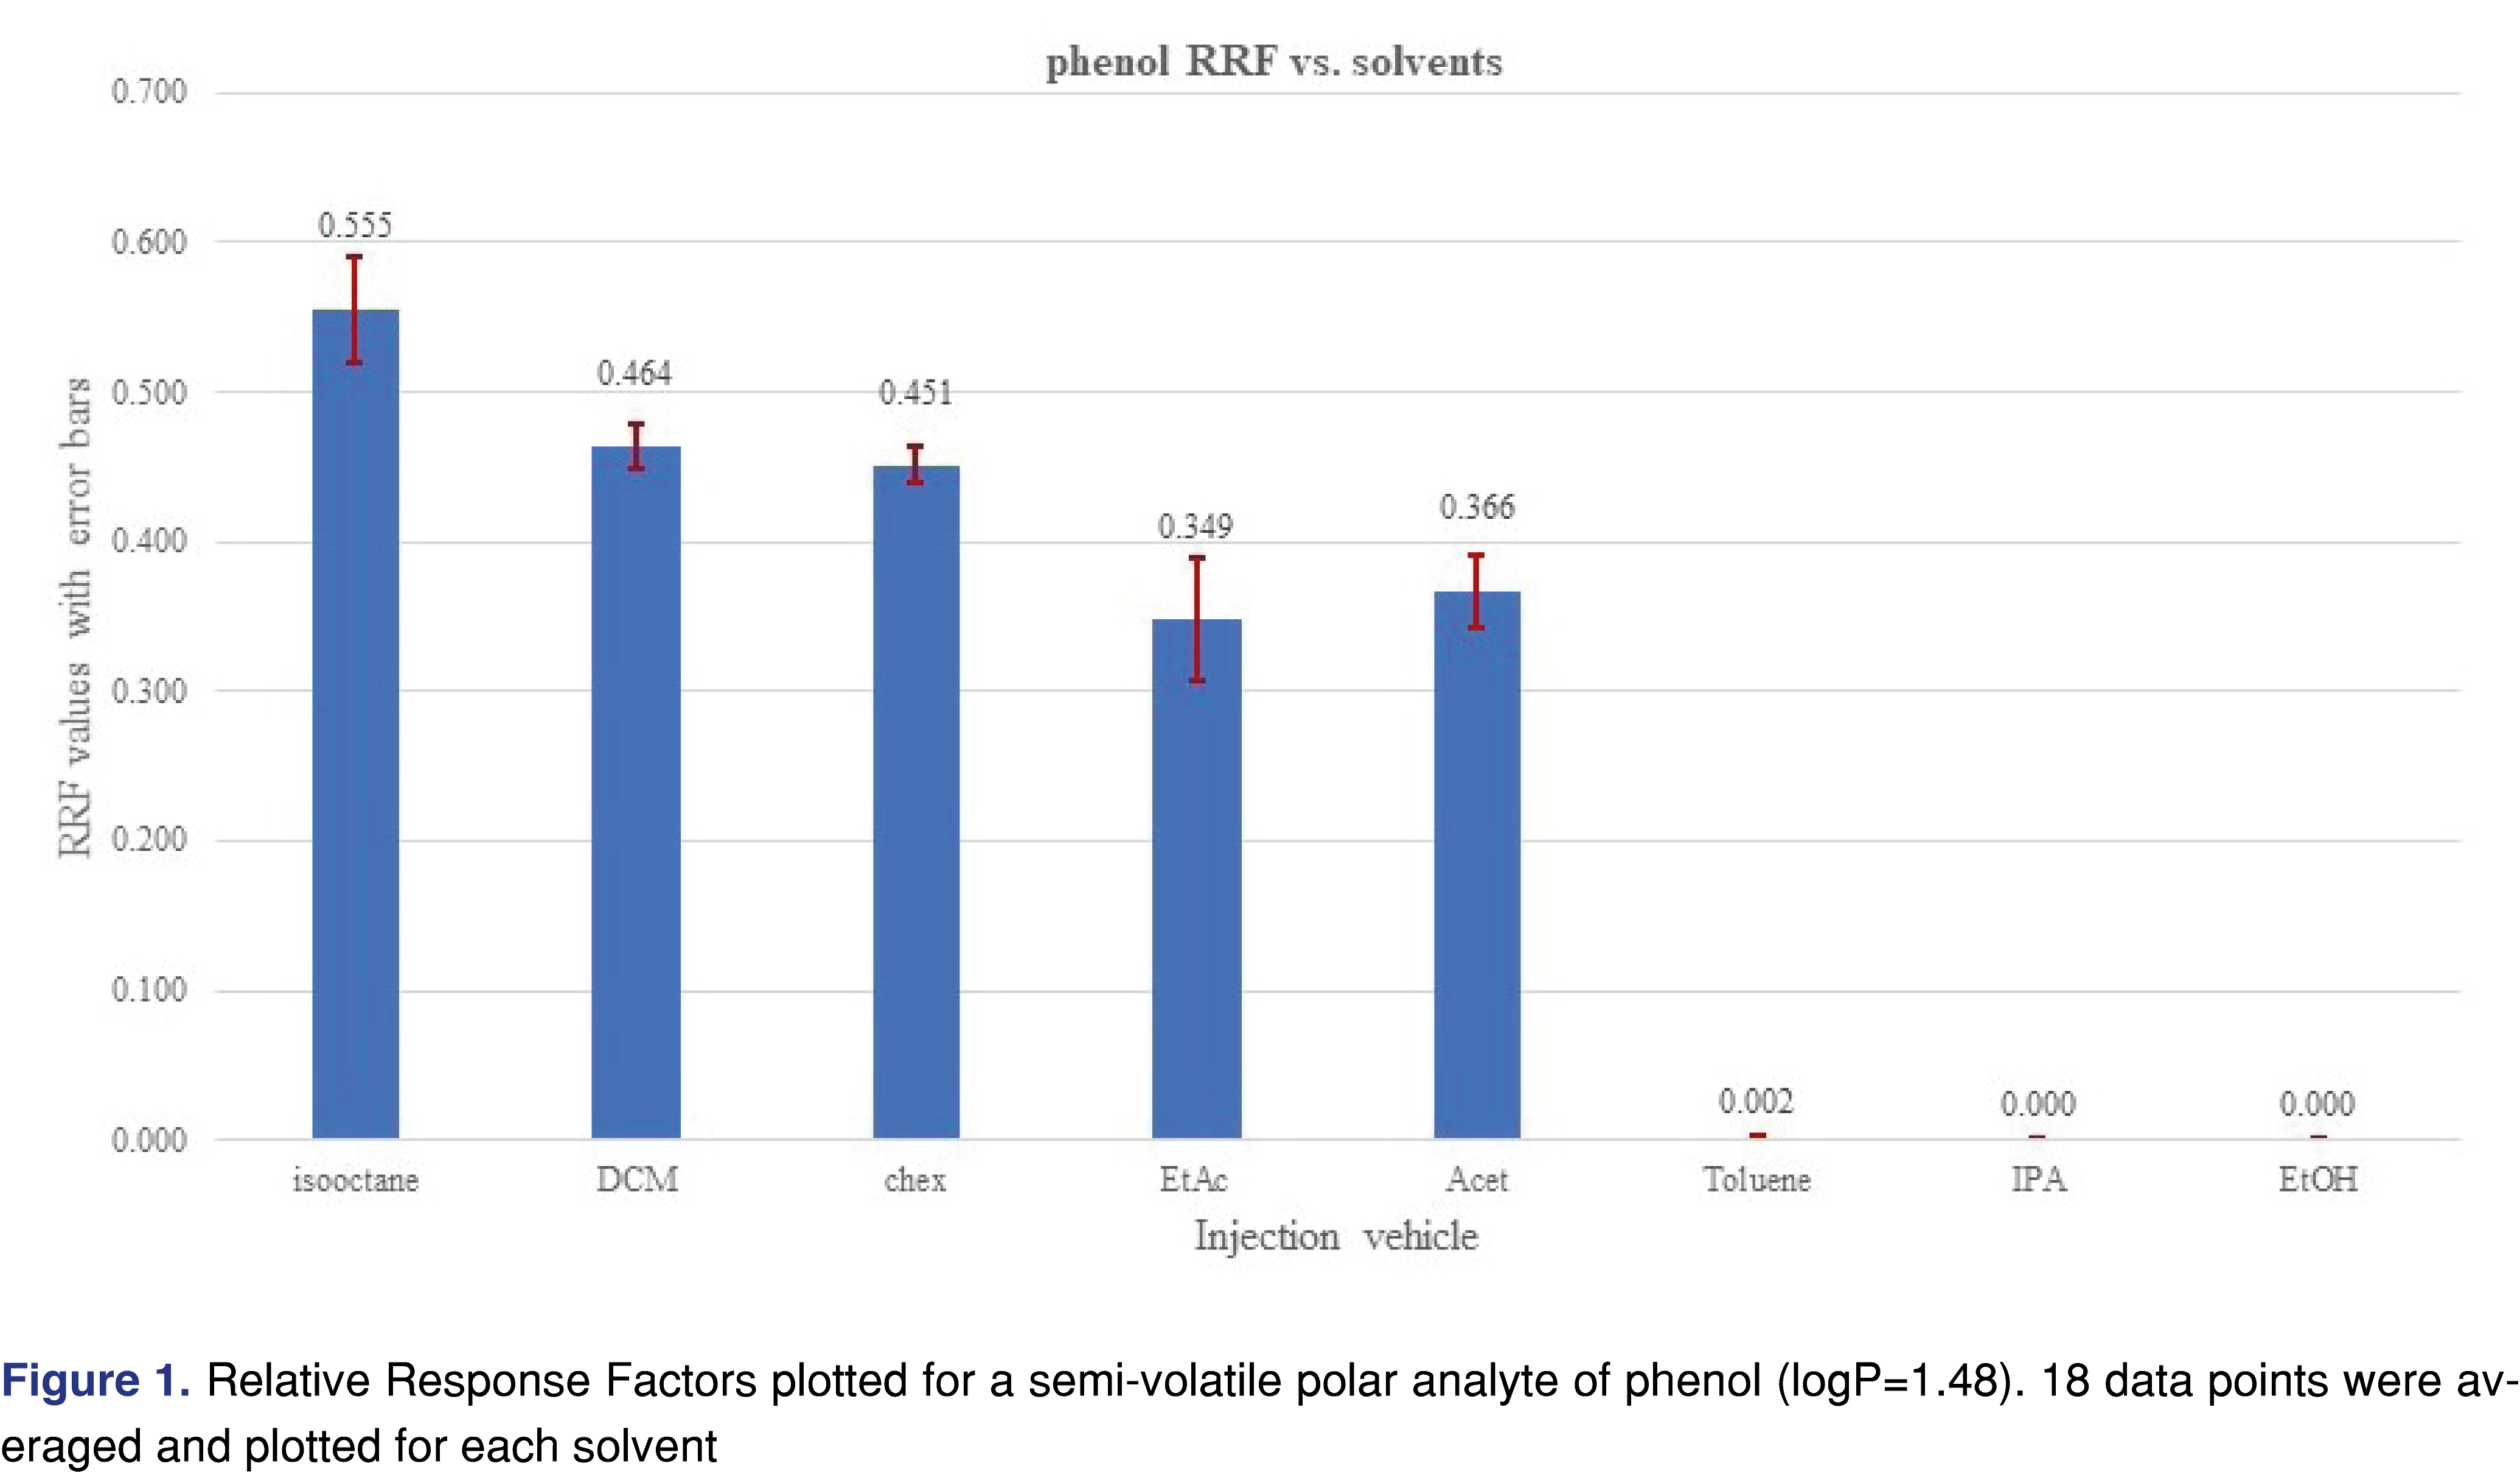
The effect of the different solvent vehicles was also evaluated in this study, using the various solvents listed in Table 2. The solvents have different physico-chemical properties, their expansion rates are different, their boiling points are different, therefore they may impact the relative responses of the different analytes used in the study [21]. For comprehensive chemical evaluation analytical laboratories are required to use of solvents of different polarity [2,9], and additionally, the solvent exchange processes in the laboratory may introduce different solvents to the analytical workflow. Therefore, it seems logical when a response database is being generated, the impact of the different solvents will be studied and understood by the laboratory. In an ideal situation, injection vehicles should not impact the results of the testing, therefore the test results or in this case the relative responses should be equal to justify use of a single solvent for database generation. It seemed that the injection solvent had not impacted the retention time of the 2-FBP IS, however, the %RSD of the injections were different for different solvents. Solutions of the different vehicles were prepared as described in the materials and methods section and injected in six replicates for each solvent at each evaluation level. The analyte/IS ratio was calculated for all the studied chemicals. Even where some of the analytes show low relative responses -and therefore a decision can be made when an actual study will be executed they will not be evaluated with this particular technique- they were included in the evaluation since the purpose of the study was to evaluate the solvent effect. Some of the analytes provided adequate response for the majority of the solvents and very little response was observed for other solvents. The most typical example for this was observed for phenol and acetophenone (Figures 1 and 2).
Phenol showed a very low response and acetophenone shows reduced response for all evaluation levels when injected in the toluene, IPA, and ethanol solvent vehicles. The boiling point of those analytes are not particularly low (phenol 181°C, acetophenone 202°C), which does not justify the low response. The low response for IPA and ethanol can be explained due to the polar nature of the solvent vehicles, as the vehicles may not transfer those analytes effectively to the column. For the low response from toluene most probably associated with a combined effect of the high boiling point and the relatively high polarity compared to the hydrocarbons (see Table 2). However, the overall plots confirm that the injection vehicle has an impact on the relative responses.
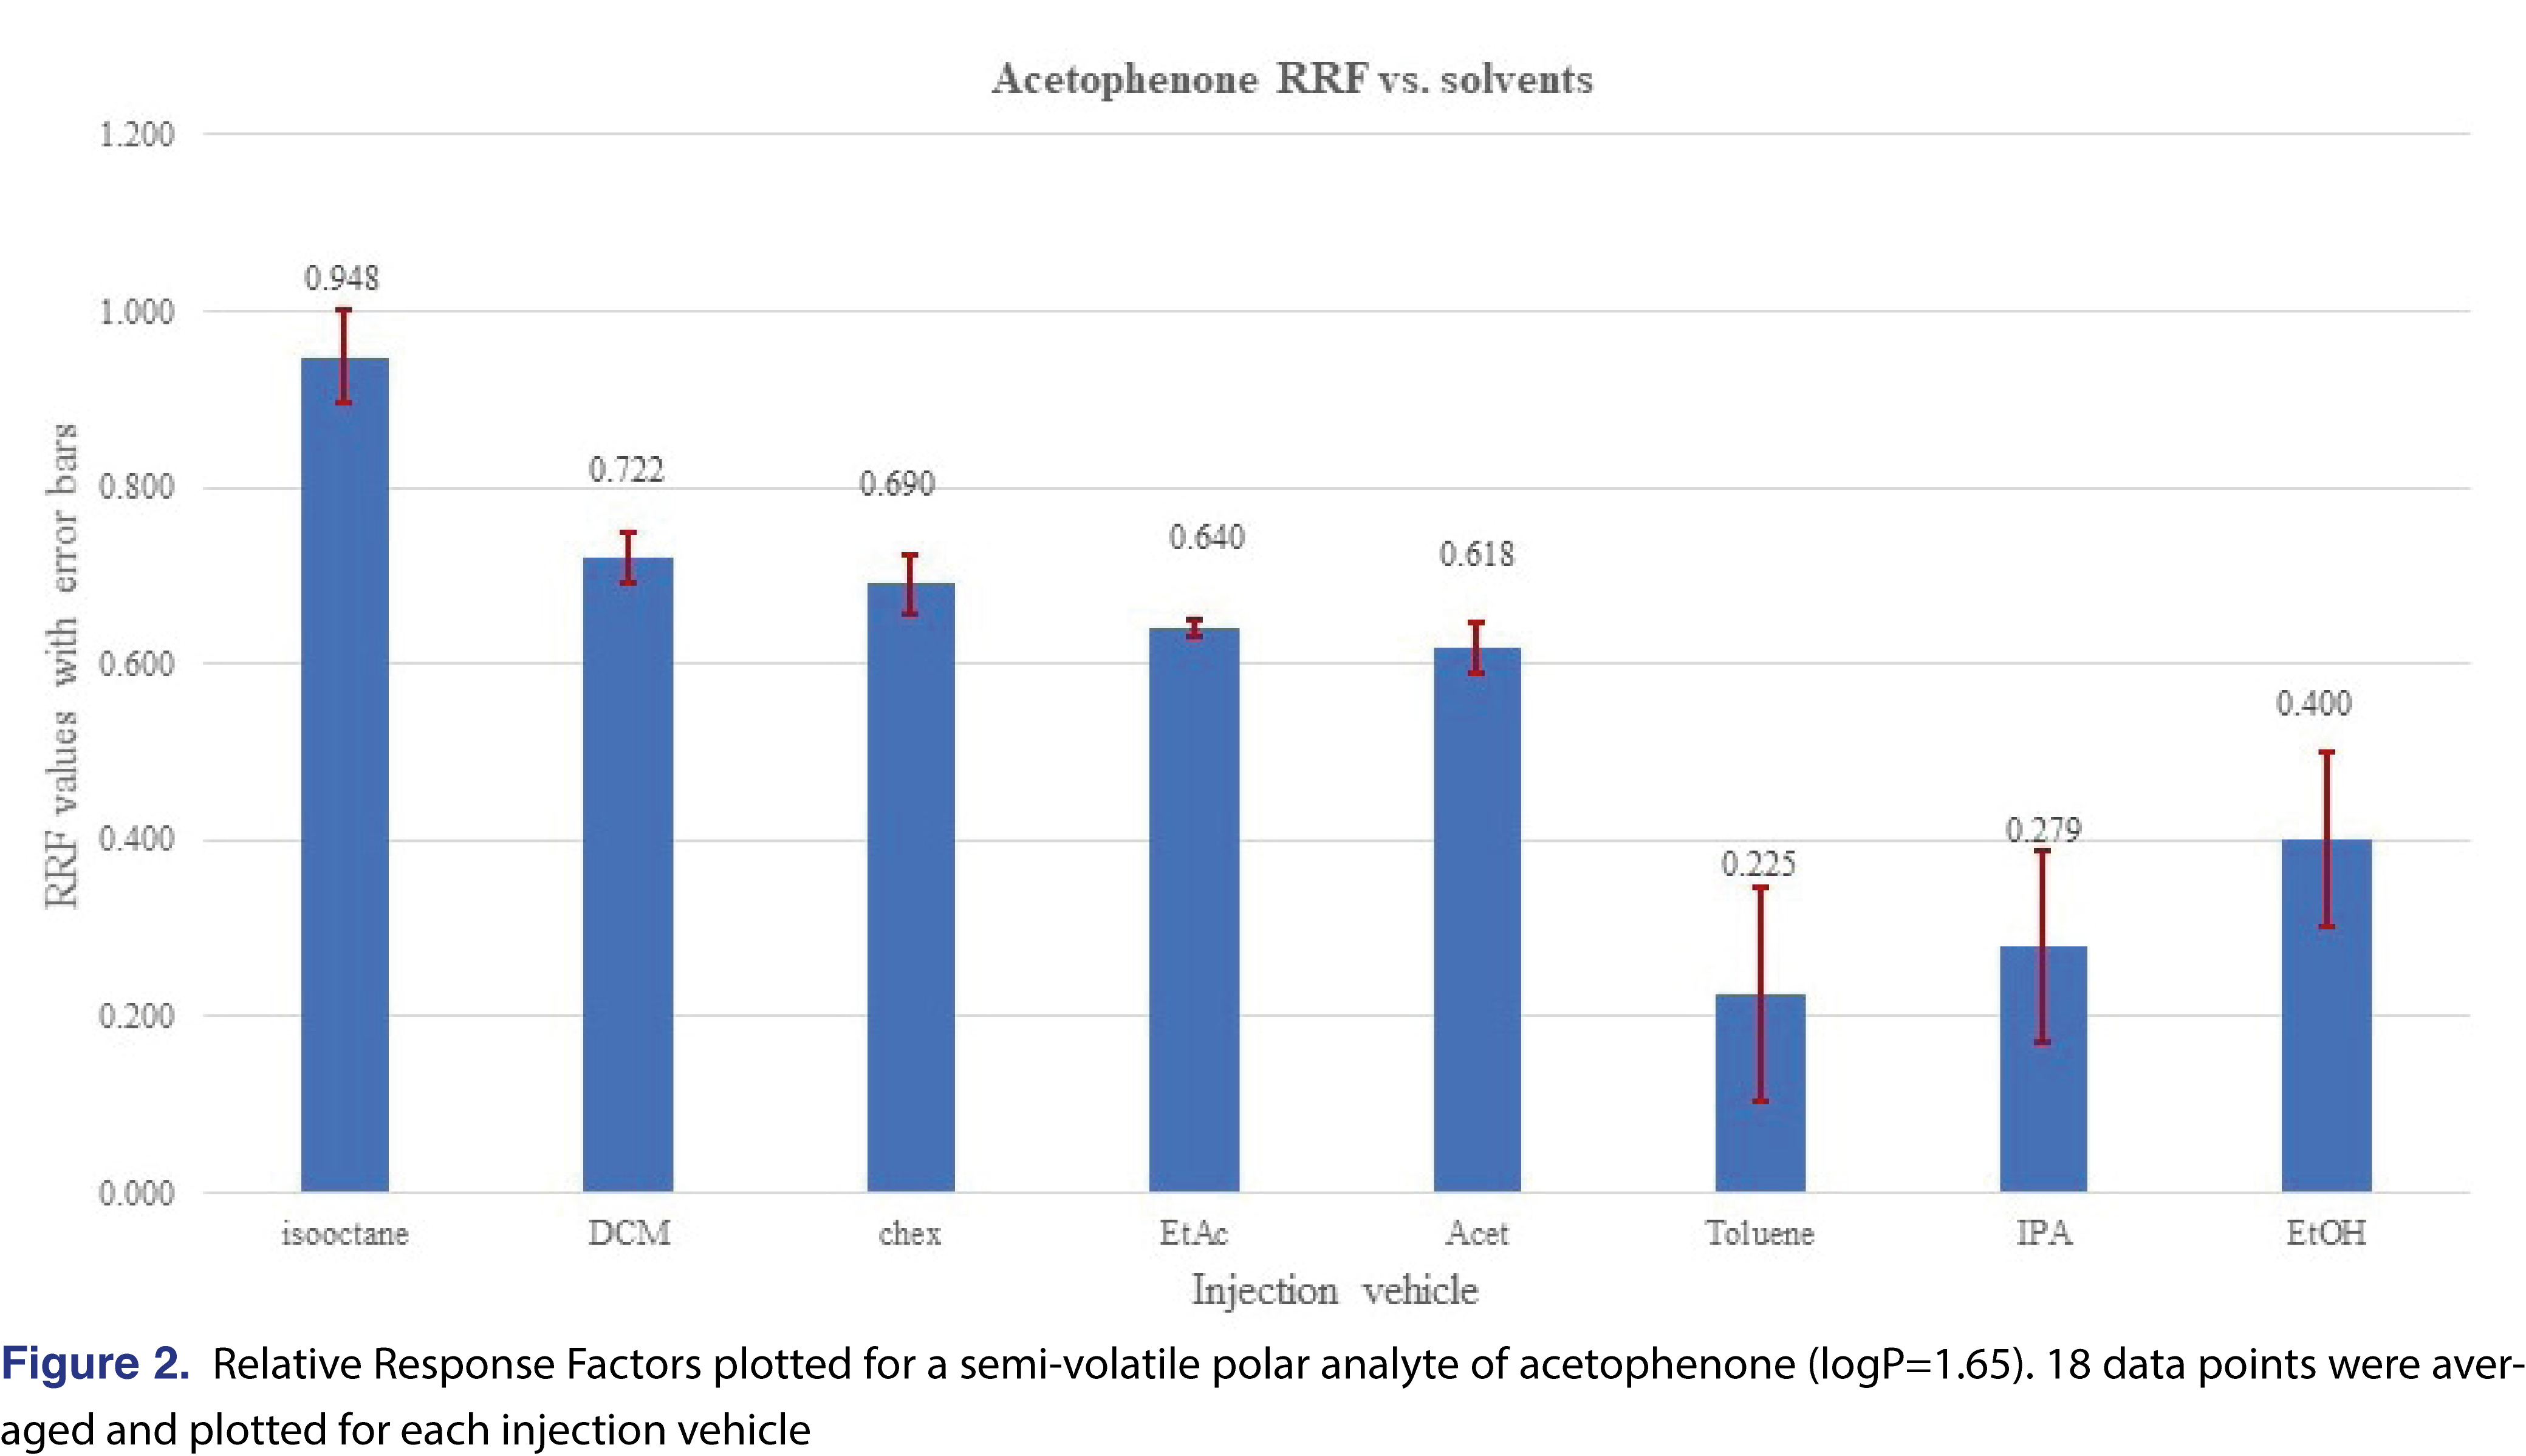
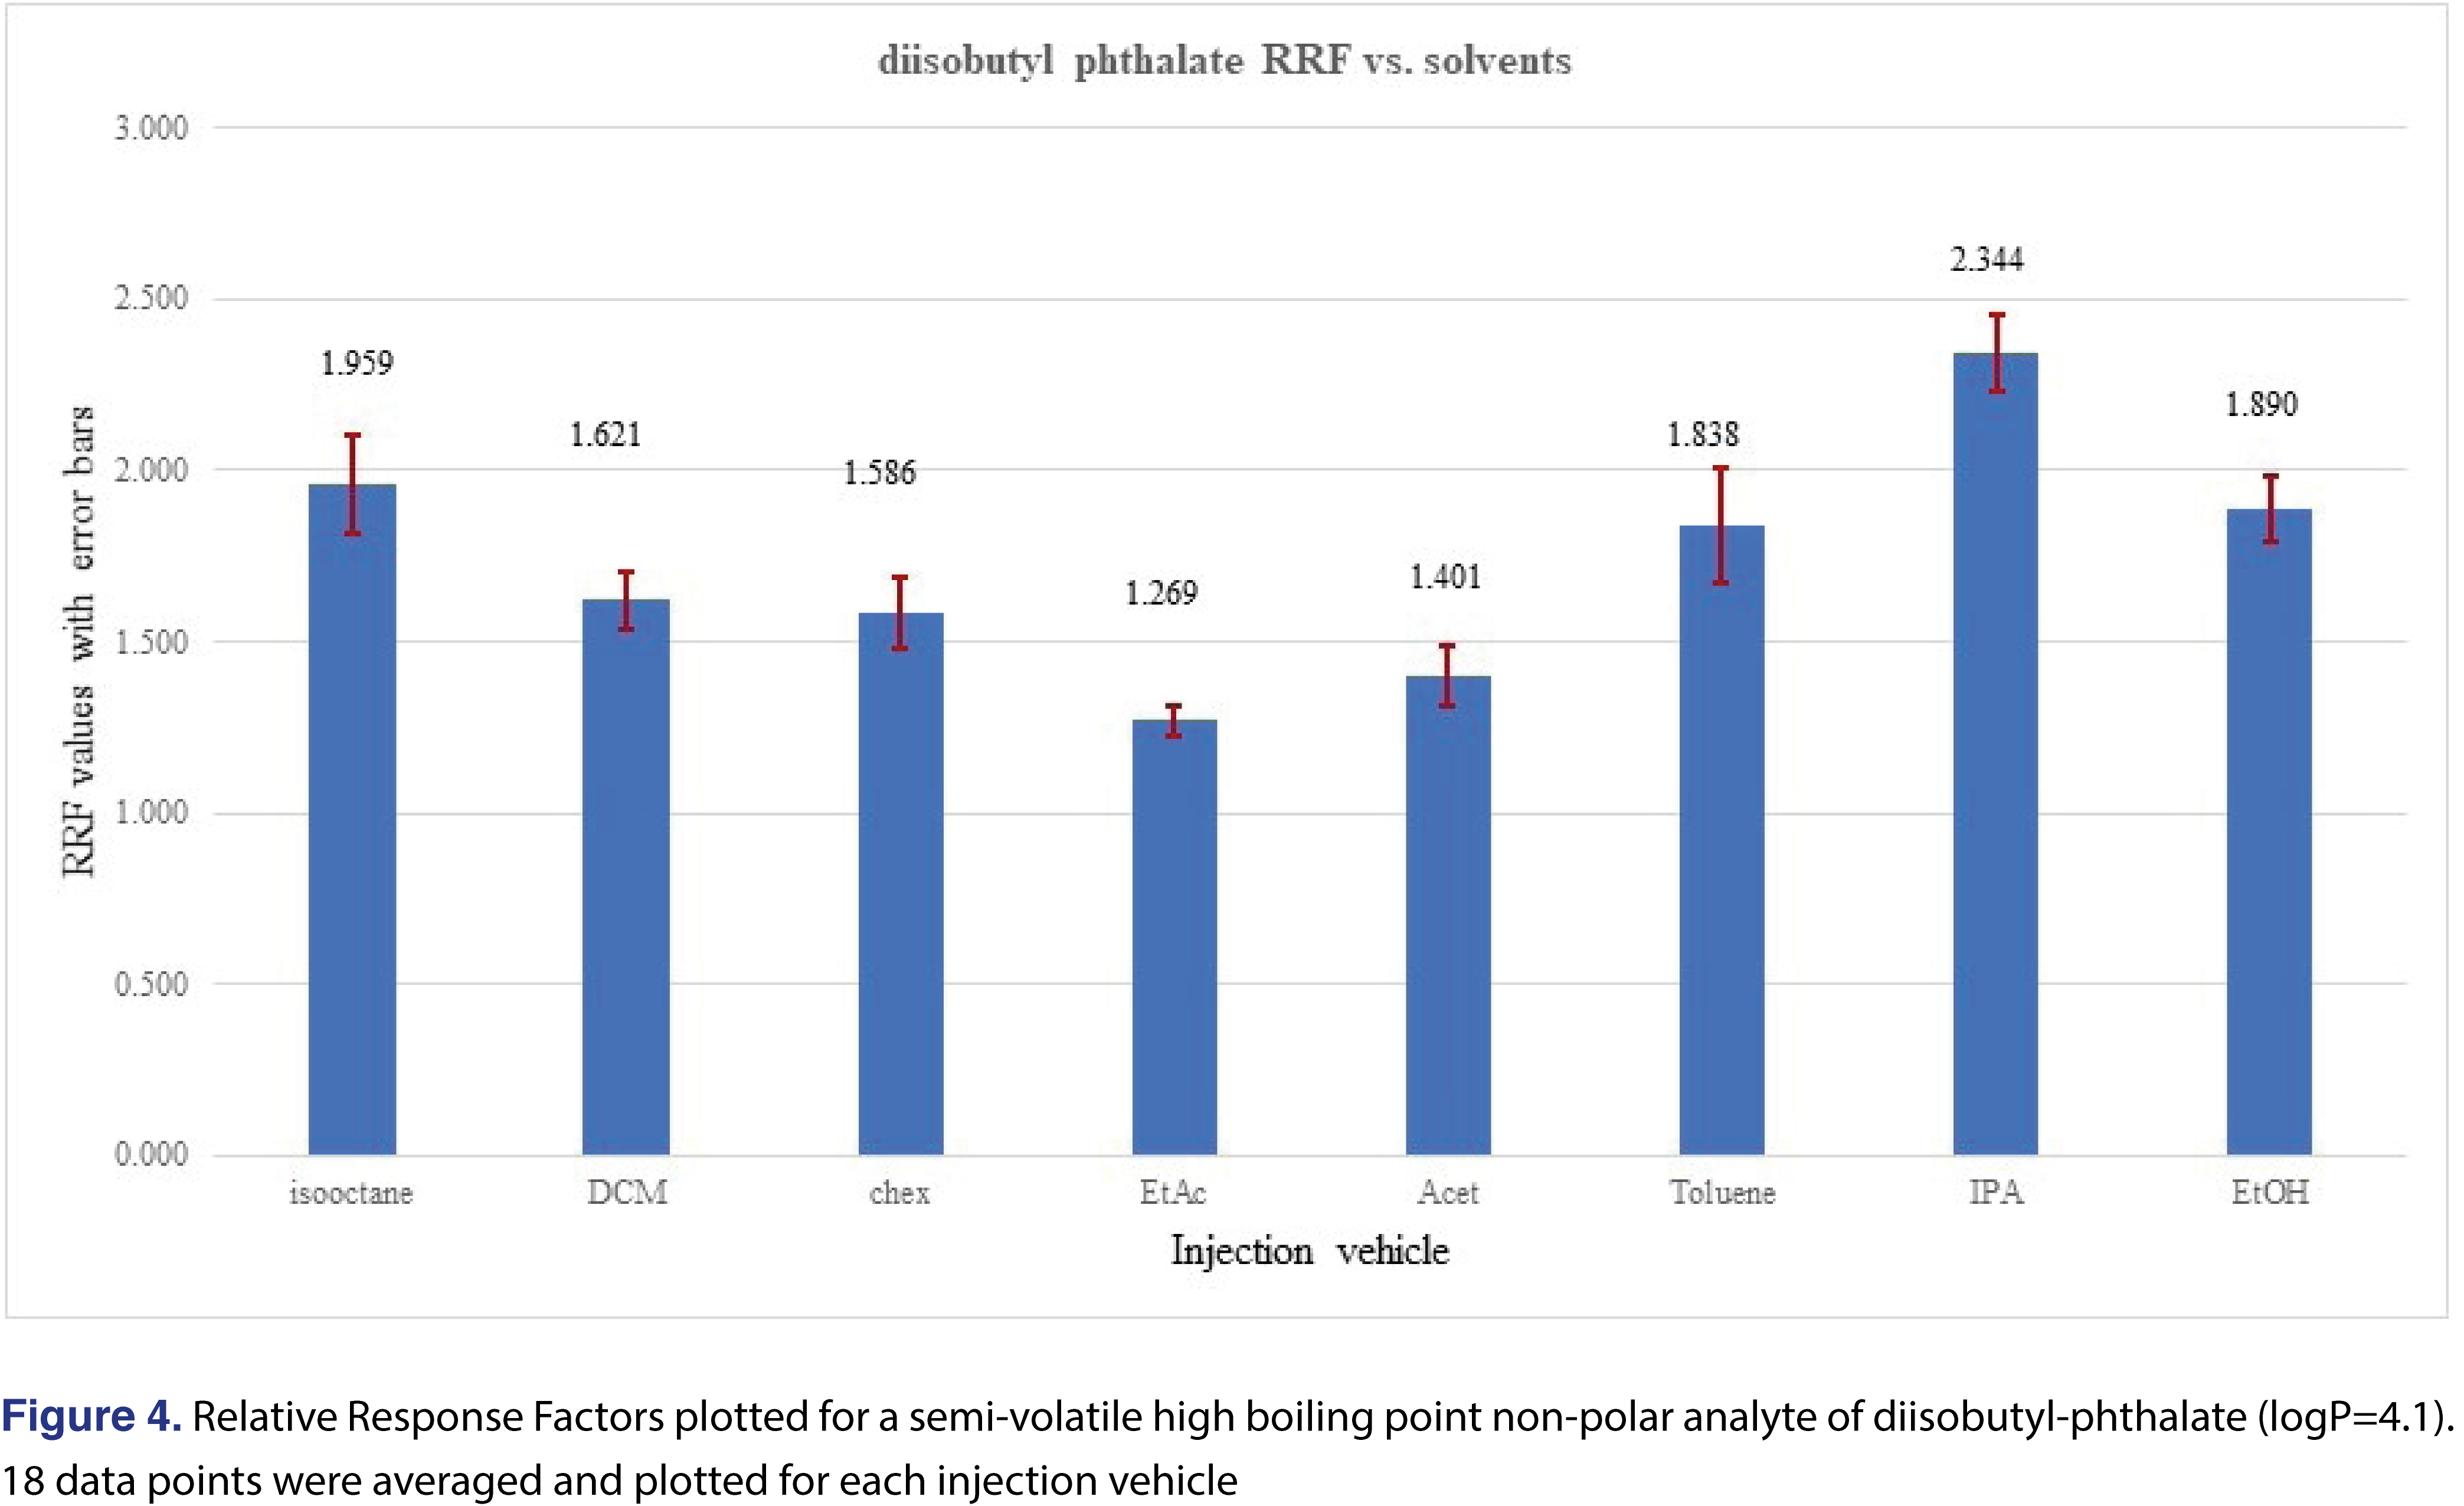
An opposite phenomenon was observed for the relative response values for Tinuvin 327 (Figure 3) and diisobutyl-phthalate (Figure 4), where using toluene, IPA or EtOH resulted in higher responses for those analytes compared to the rest of the injection vehicles.
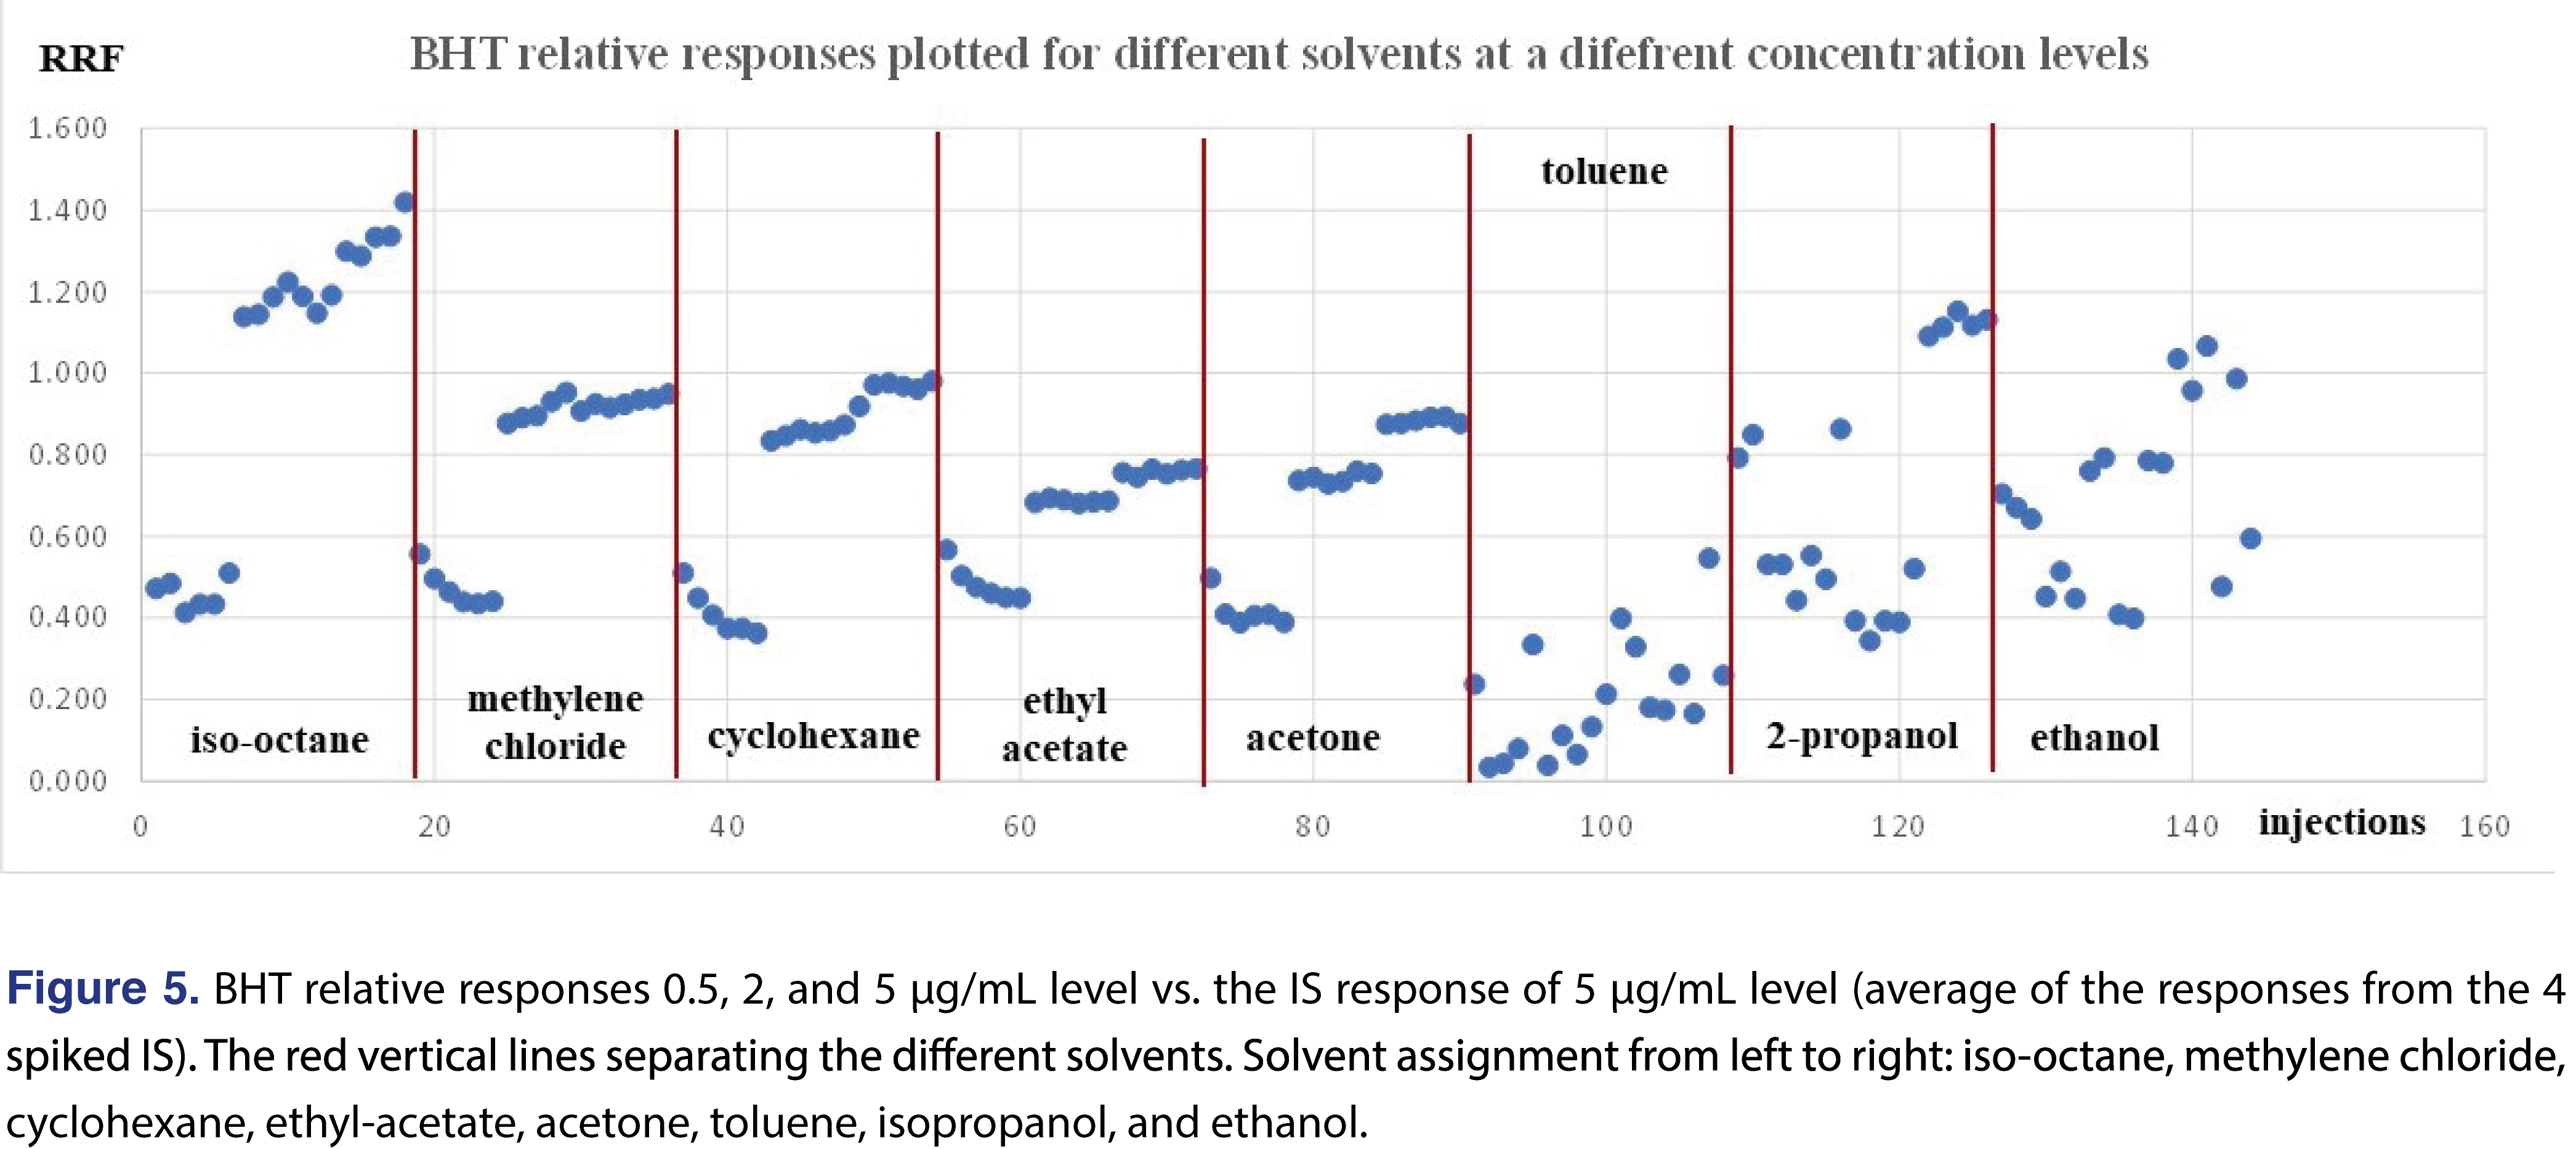
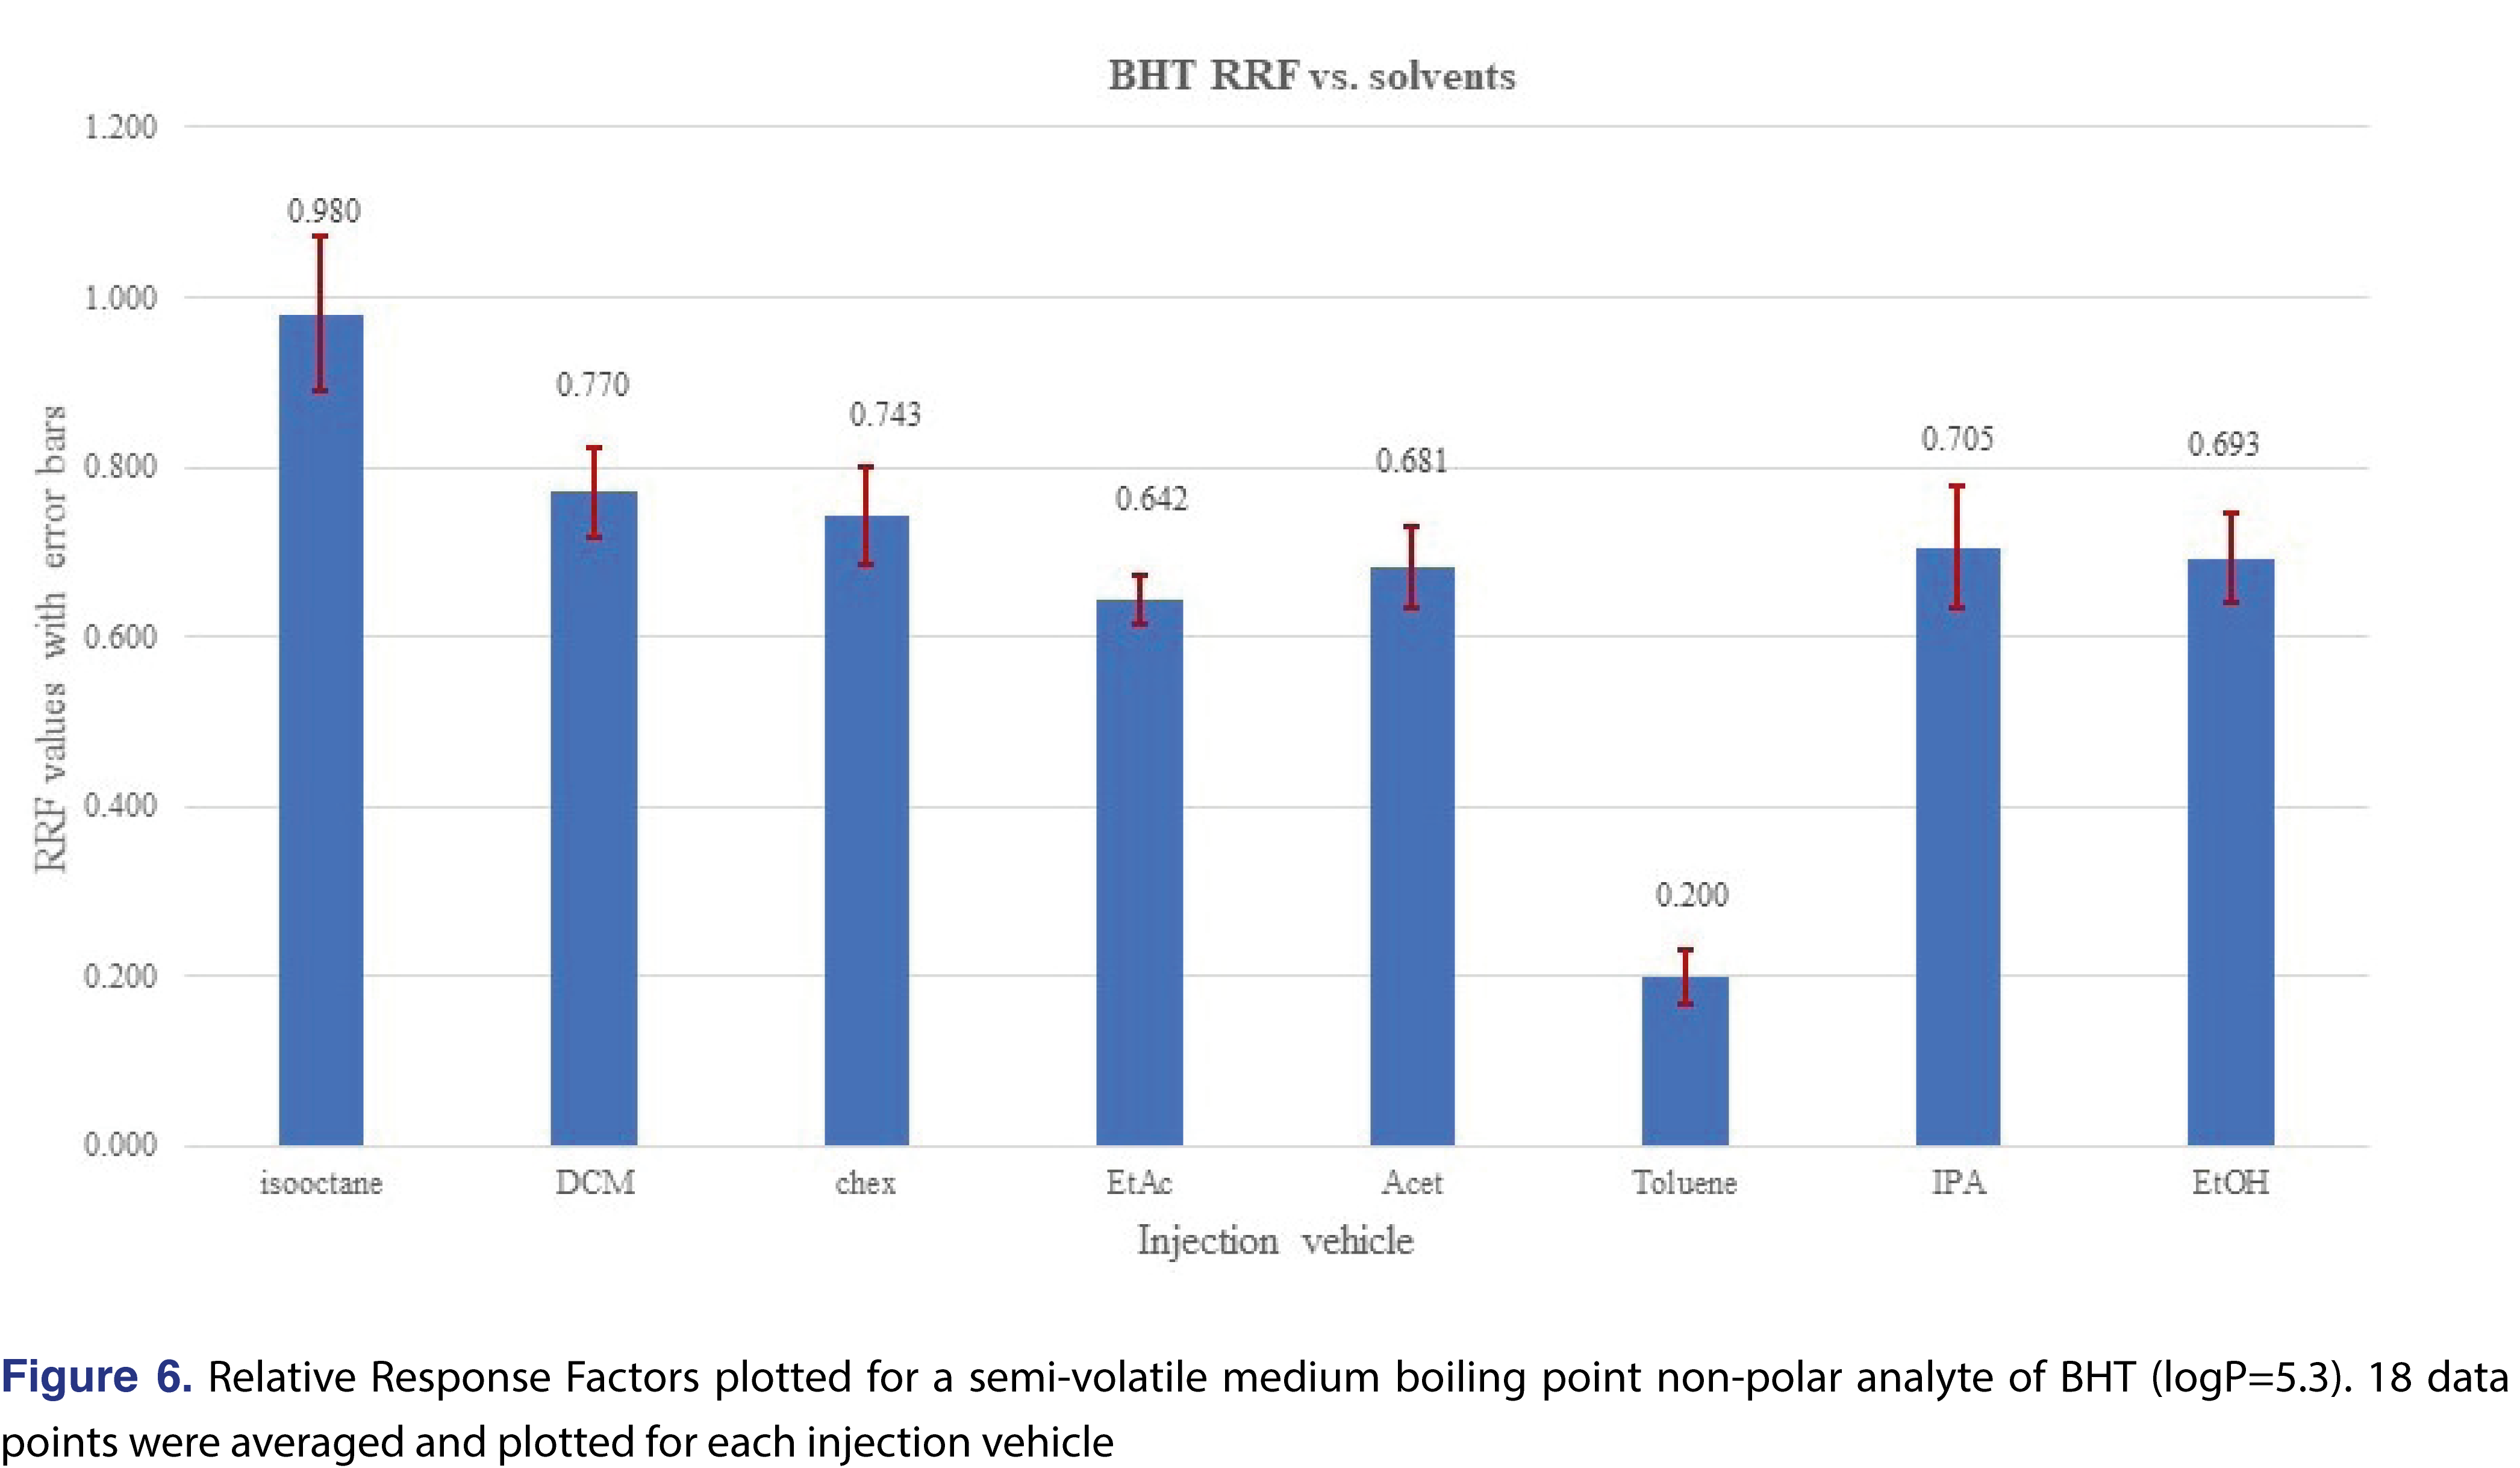
A higher level of complexity is presented in Figure 5, where the relative responses for BHT were plotted for each level and each injection vehicle. The red vertical lines on the Figure divide the different injection vehicles. The individual relative responses were plotted and isooctane, DCM, cyclohexane, ethyl-acetate, and acetone show very similar patterns, slightly lower response at 0.5 ppm level than the rest of the concentrations. When the average of the 18 injections of each injection vehicle were plotted, the only “outlier” is toluene, (isooctane is slightly higher than the rest), however, the rest of the injection vehicles show similar response. It means that if BHT is being evaluated, the calculated results for the 4 most commonly used solvents (DCM, cyclohexane, IPA, and ethanol), would be very close to each other. This provides justification that for some analytes the relative responses are almost independent of the injection solvent (Figure 6).
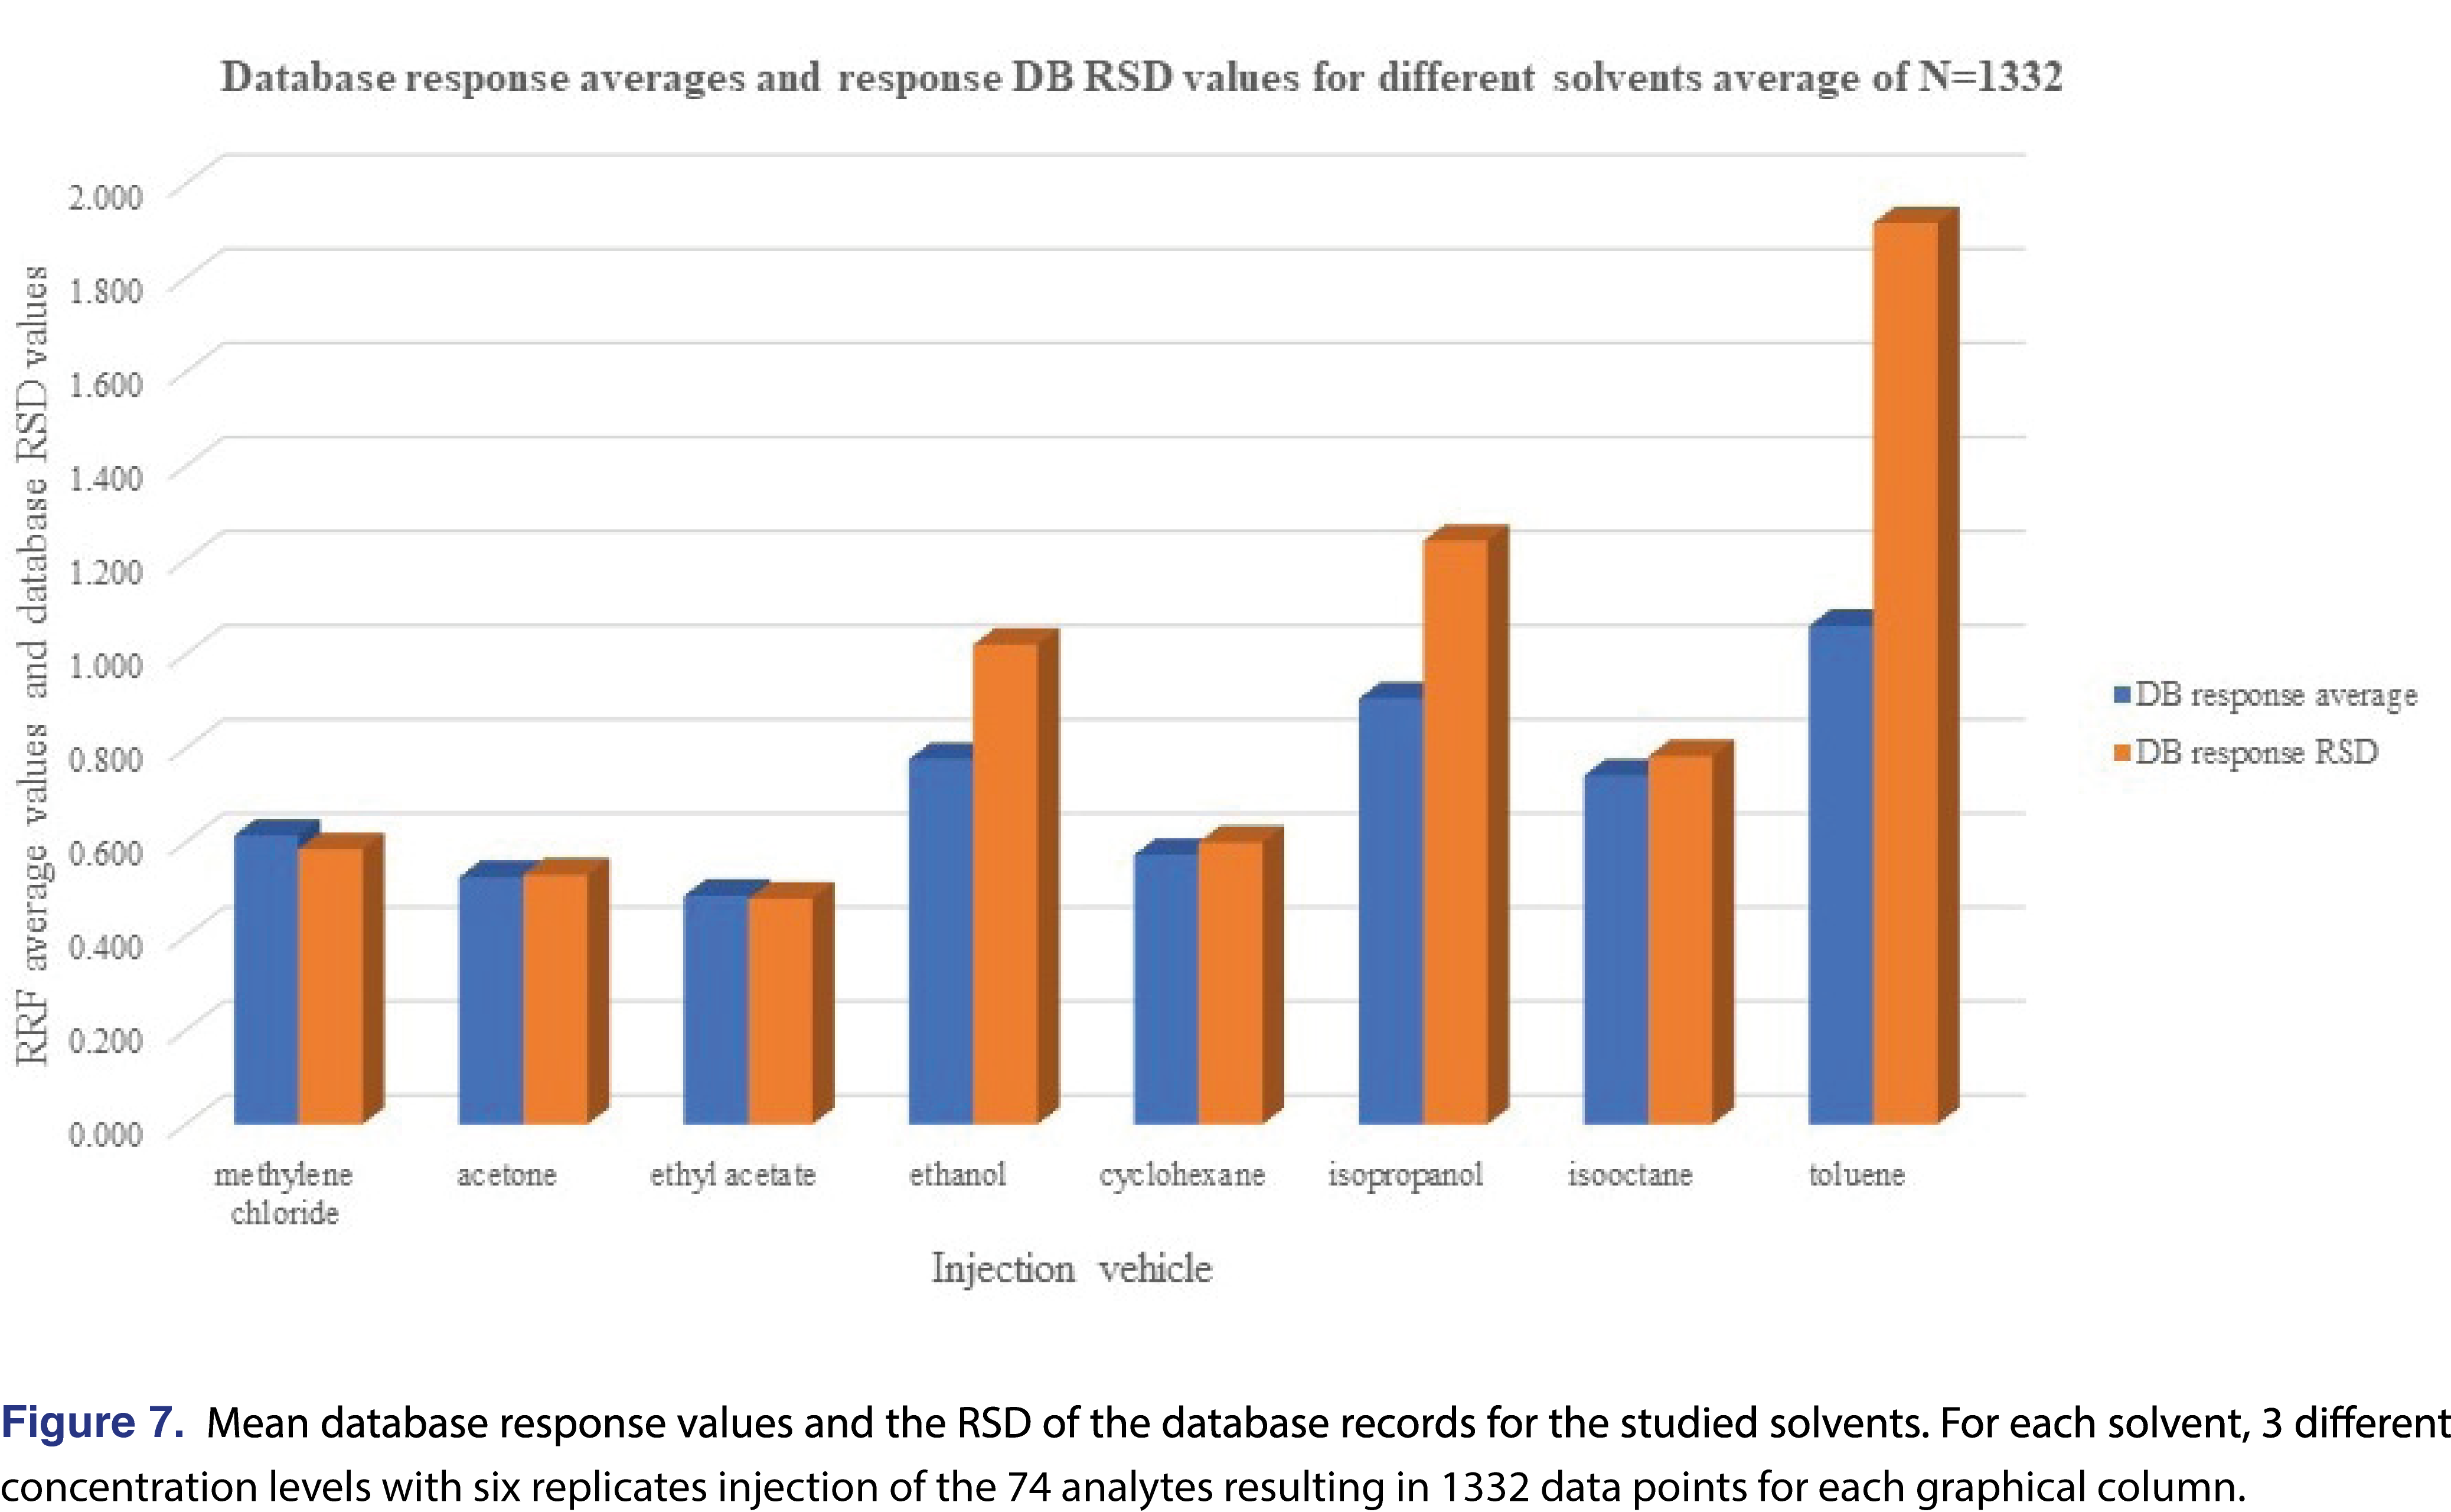
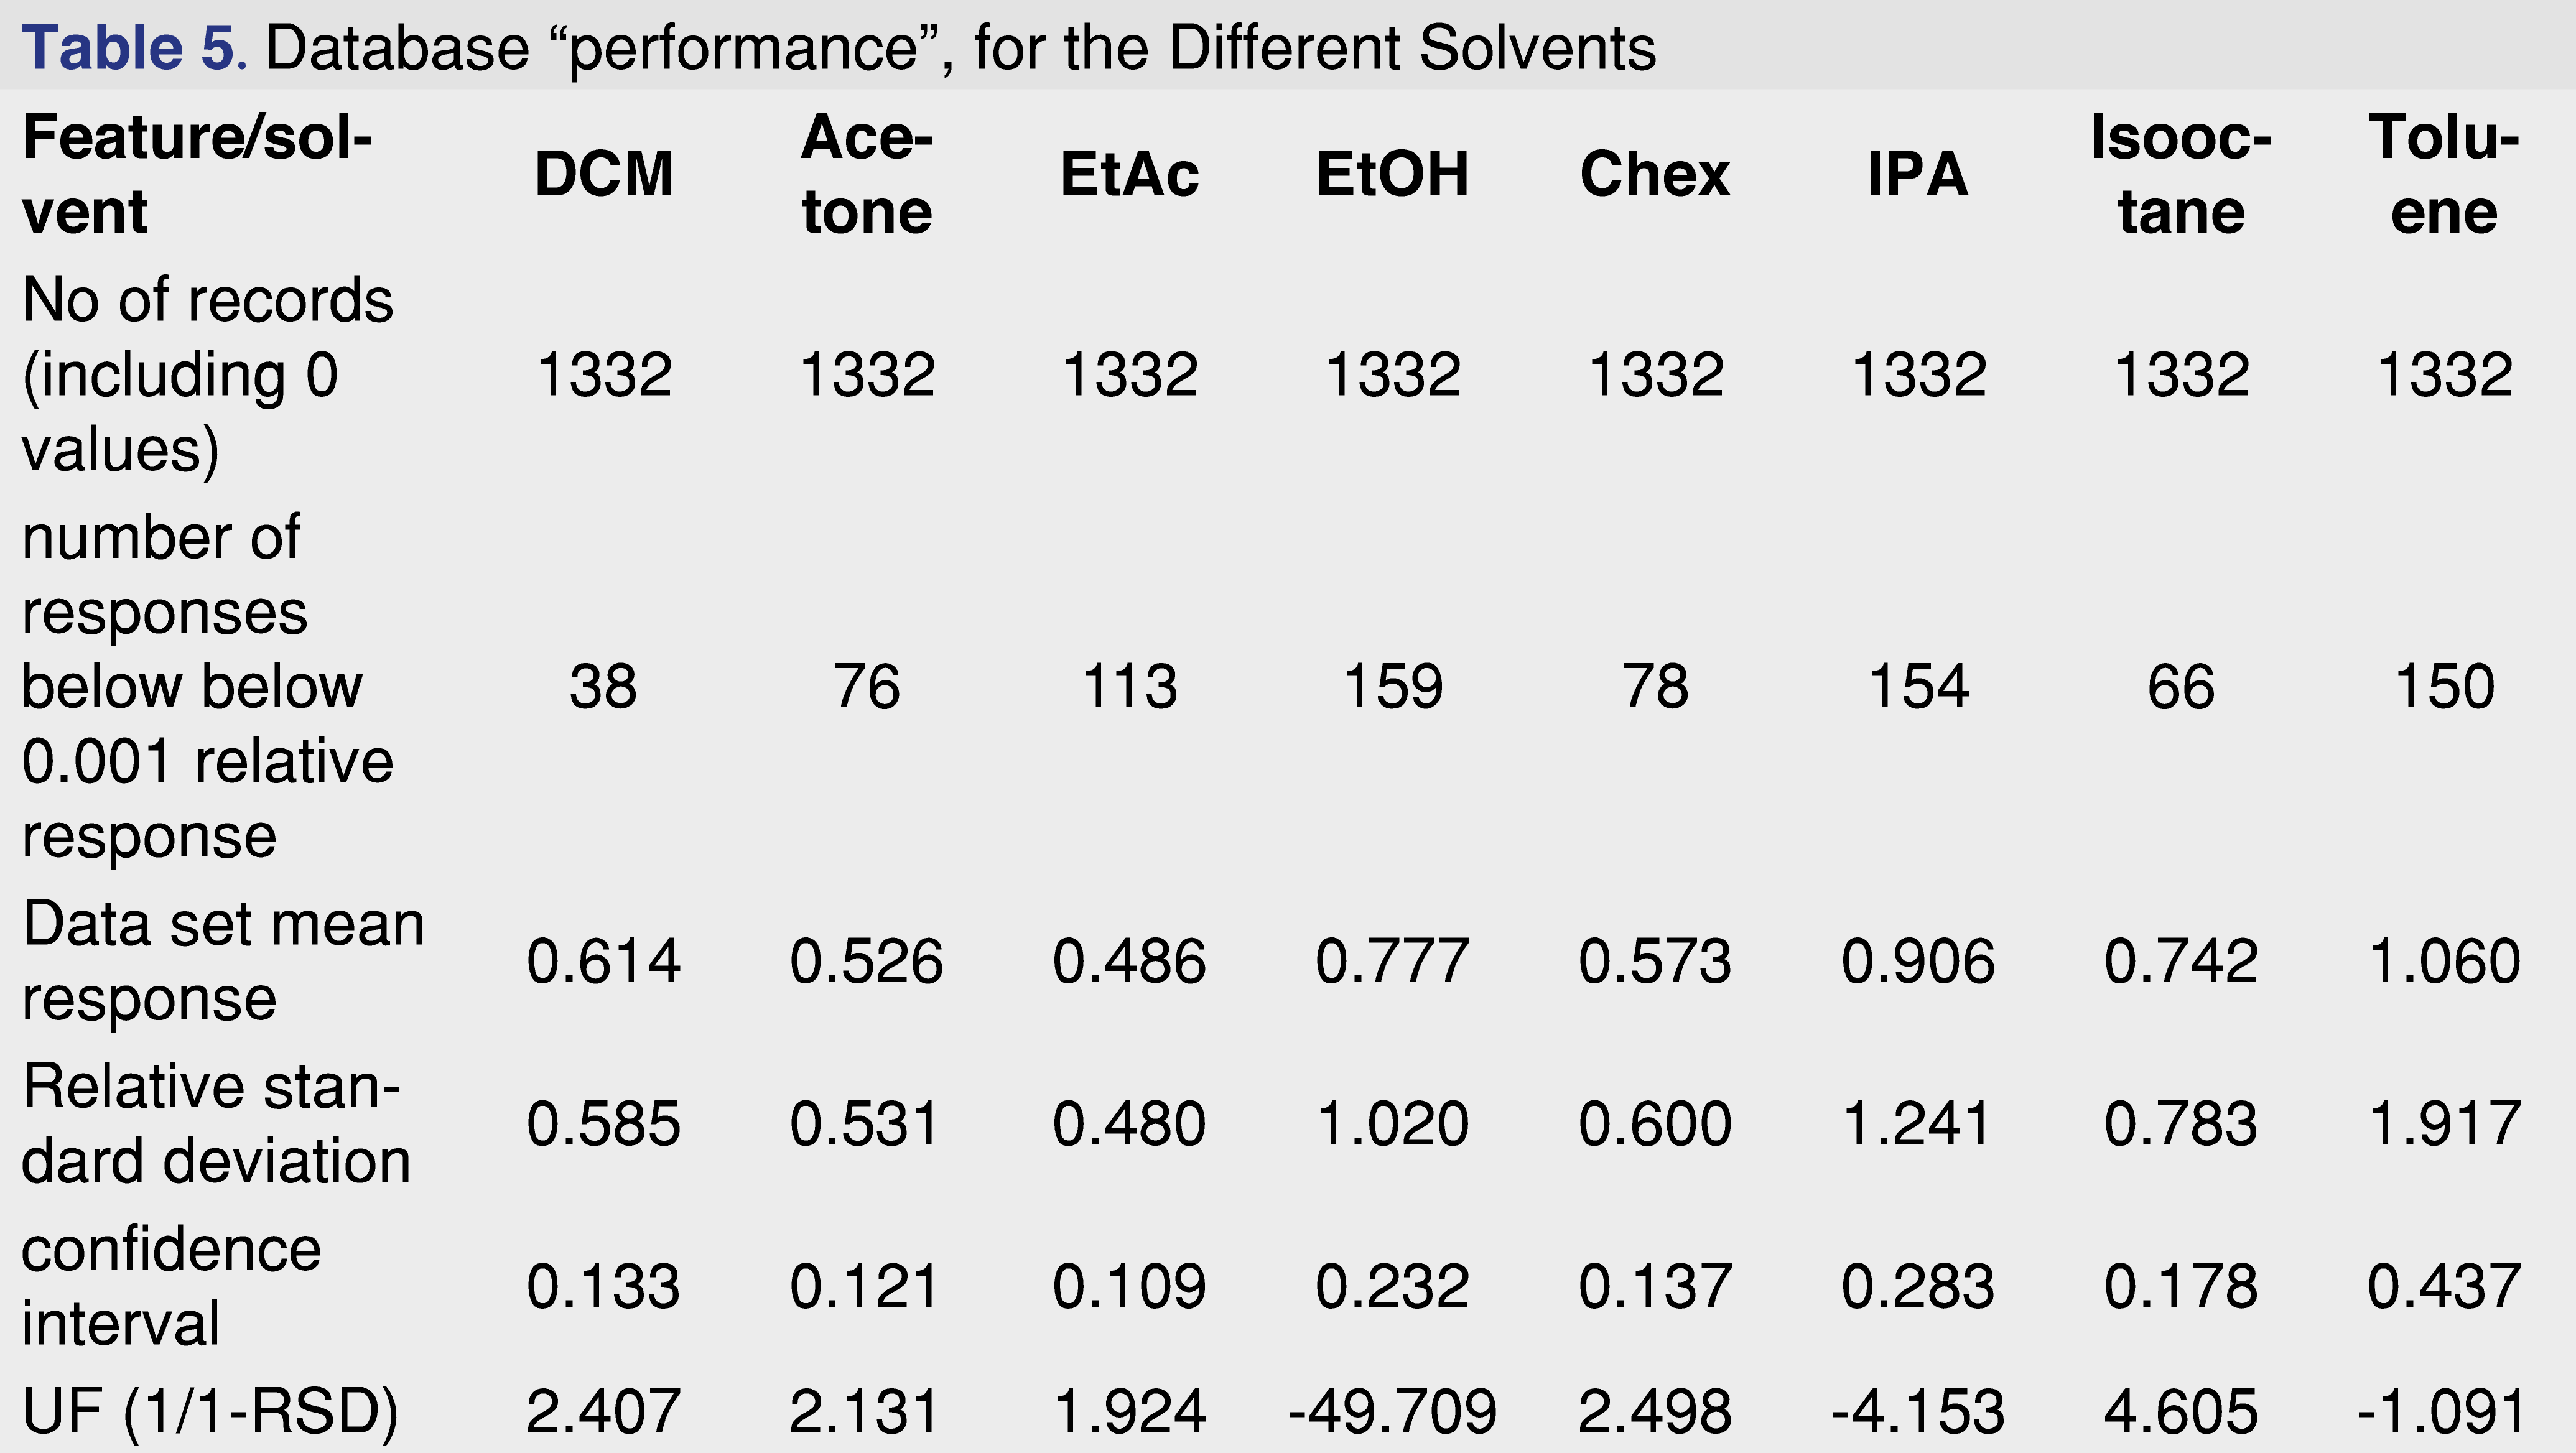
The overall features of the study database are presented in Table 5, and the relative response averages and the RSD values for each individual solvents are plotted in Figure 7. The average responses for the most commonly used solvents of DCM, cyclohexane (actually hexanes is the most commonly used, however since cyclohexane is available in higher purity our laboratory uses it as apolar solvent instead of hexanes), isopropanol, and ethanol are 0.614, 0.573, 0.906, and 0.777. The average values for DCM and cyclohexane are very close to each other and IPA is the highest between the 4 solvents. Ethanol and IPA also have the two highest number of low responders, with ethanol the highest of 12% of the studied analytes showing relative response below 0.001. For this aspect DCM and isooctane had the lowest numbers of low responders, 2.9% and 5.0% respectively. For solvents such DCM, acetone, ethyl-acetate, and cyclohexane the RSD of the database values are acceptable and the UF of the database values calculated (see Table 5), for those solvents are in a range of 1.924-2.498, therefore those data sets can be used for AET adjustment in the analytical workflow process. For the rest of the solvents, either the UF is above 4 (which for GC-MS is relatively high), or since the RSD of the database records are above 1 those subsets are not recommended to use for AET adjustment [18], the variation in response factors is so large that although a UF can be calculated, its scientific validity becomes questionable [2]. The database still has some use for those solvent entries, as they still can be used for quantitative assessment for the individual analytes included within the database.
The “usefulness” of the response factor database can be quickly evaluated by plotting the mean response values for the subset and the RSD of that particular subset. It can be easily observed that the UF correction approach can be used for DCM, acetone, ethyl-acetate, and cyclohexane, and for the other 4 solvents it is not justifiable based on scientific practice.
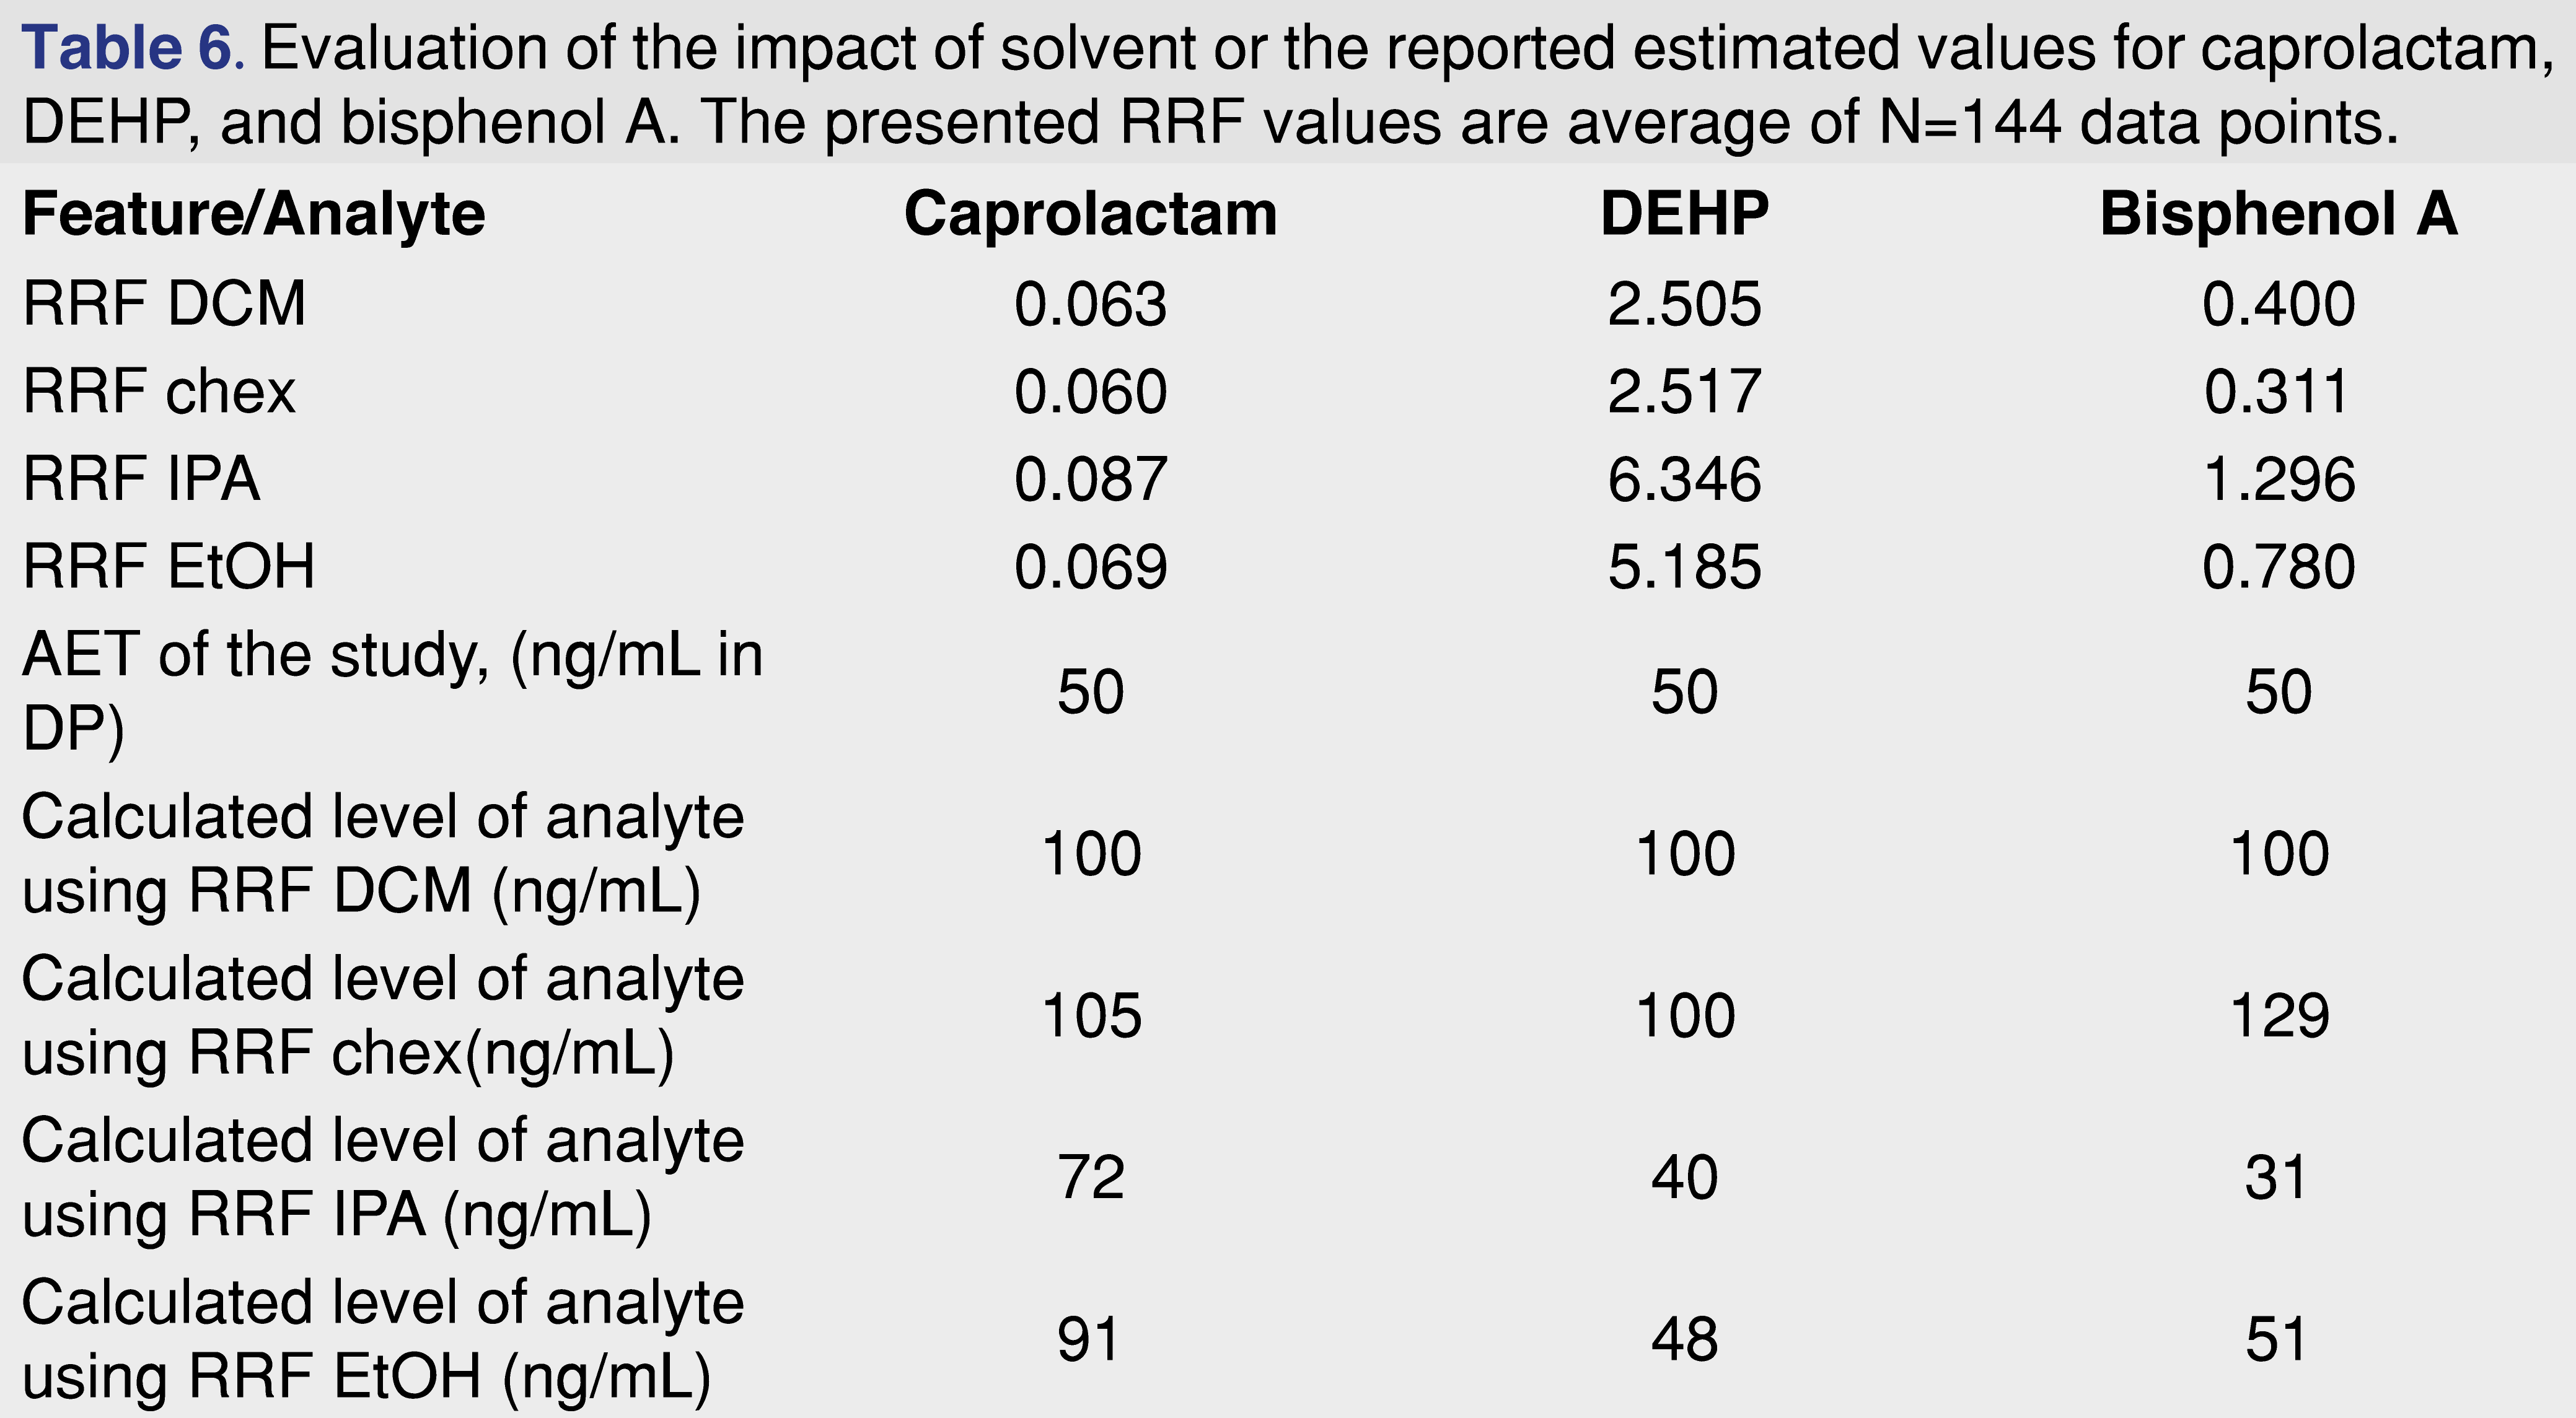
A hypothetical scenario was presented in Table 4 where different relative responses assigned to different evaluation levels impacted the outcome of the safety assessment, and a similar question can be asked here. Should RRF values generated using one solvent be used for quantitation of a study executed using a different solvent? The data presented in Table 6 presents a scenario when a laboratory observing a same analyte IS ratio for different solvents calculates sample results. If the RRF is higher for the particular solvent, it is obvious that the same ratio would be associated with a lower level of analyte and vice versa, lower response is associated with higher actual amount in the sample. The table shows, that if the laboratory observes the same analyte/IS response, and the database is based on the DCM responses, the amount of the analytes will be reported to be lower than the actual value for lower relative response and will be reported higher than the actual value. For example, bisphenol A in the DCM solvent would be calculated as 100 ng/mL, if the same ratio is observed for cyclohexane and the DCM response is used, a same 100 ng/mL will be reported, however, based on the response for cyclohexane the actual concentration is 129 ng/mL, and for isopropanol using the DCM RRF a 100 would be reported, for an actual concentration of 31 ng/mL.
Underreporting the actual value of the analyte is not a favorable situation from a toxicological risk assessment perspective, and should be avoided, however overestimating the amount of the analyte may cause unnecessary laboratory work, including further confirmation of the levels and activities such as analytical method validation.
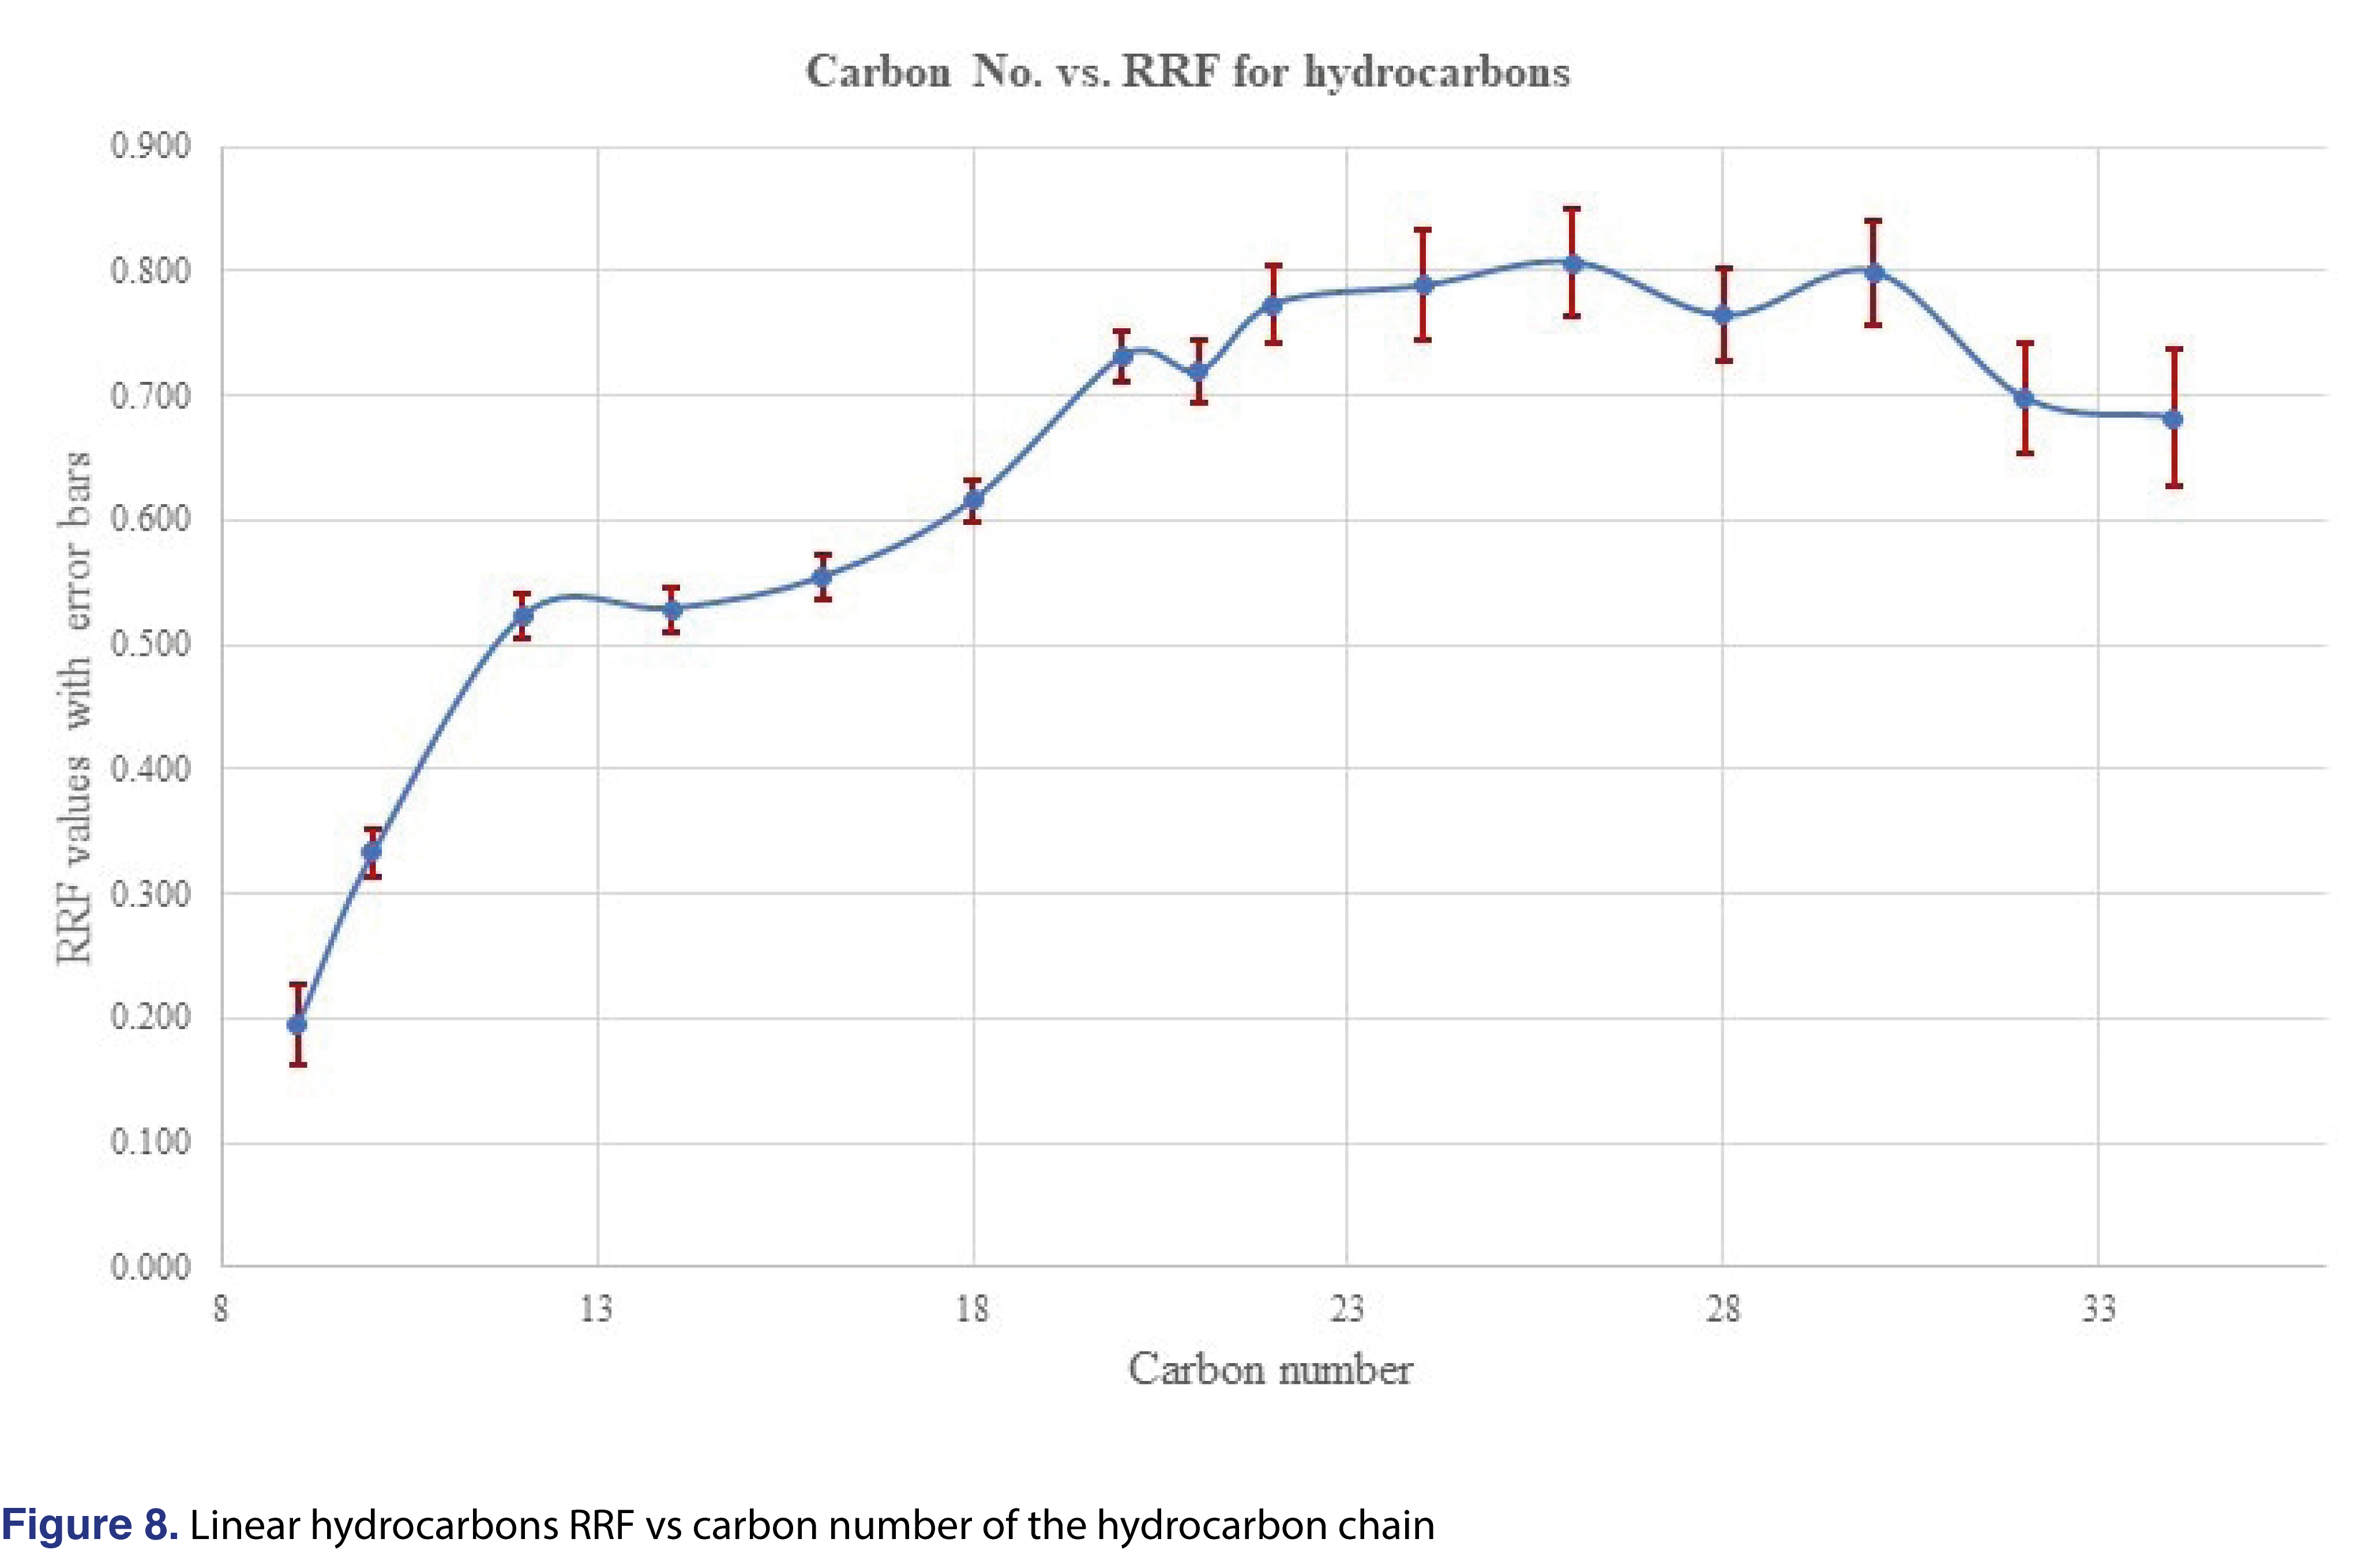
The last question that the authors would like to discuss is if the response of an unknown analyte would be predictable, or if the prediction of responses would carry any scientific merit. A paper by Jenke et al was published recently [15], discussed that such a prediction for structurally unrelated analytes cannot be made. On the other hand, Zdravkovic et al [28], observed that for similar structures some sort of prediction is possible. Mathematical modeling for prediction was also published, and the authors observed reasonable correlation between the analytical responses and the structure for chemically similar analogues [31]. In our study, we have evaluated different groups of chemicals, which included several series of homologues (aliphatic hydrocarbons C9-C34, polynuclear aromatics, phthalates with different ester chain length). The RRF plots for the average of 144 injections for each analyte were plotted in Figures 8-10. Based on those plots, reliable prediction, even for homologous chemicals, is difficult to achieve. For hydrocarbons, once the carbon number reaches n=18 to about 32, a constant relative response is observed, therefore maybe in that region the response for the odd number hydrocarbons can be estimated. The prediction most probably will not work for branched or heavily-branched hydrocarbons.
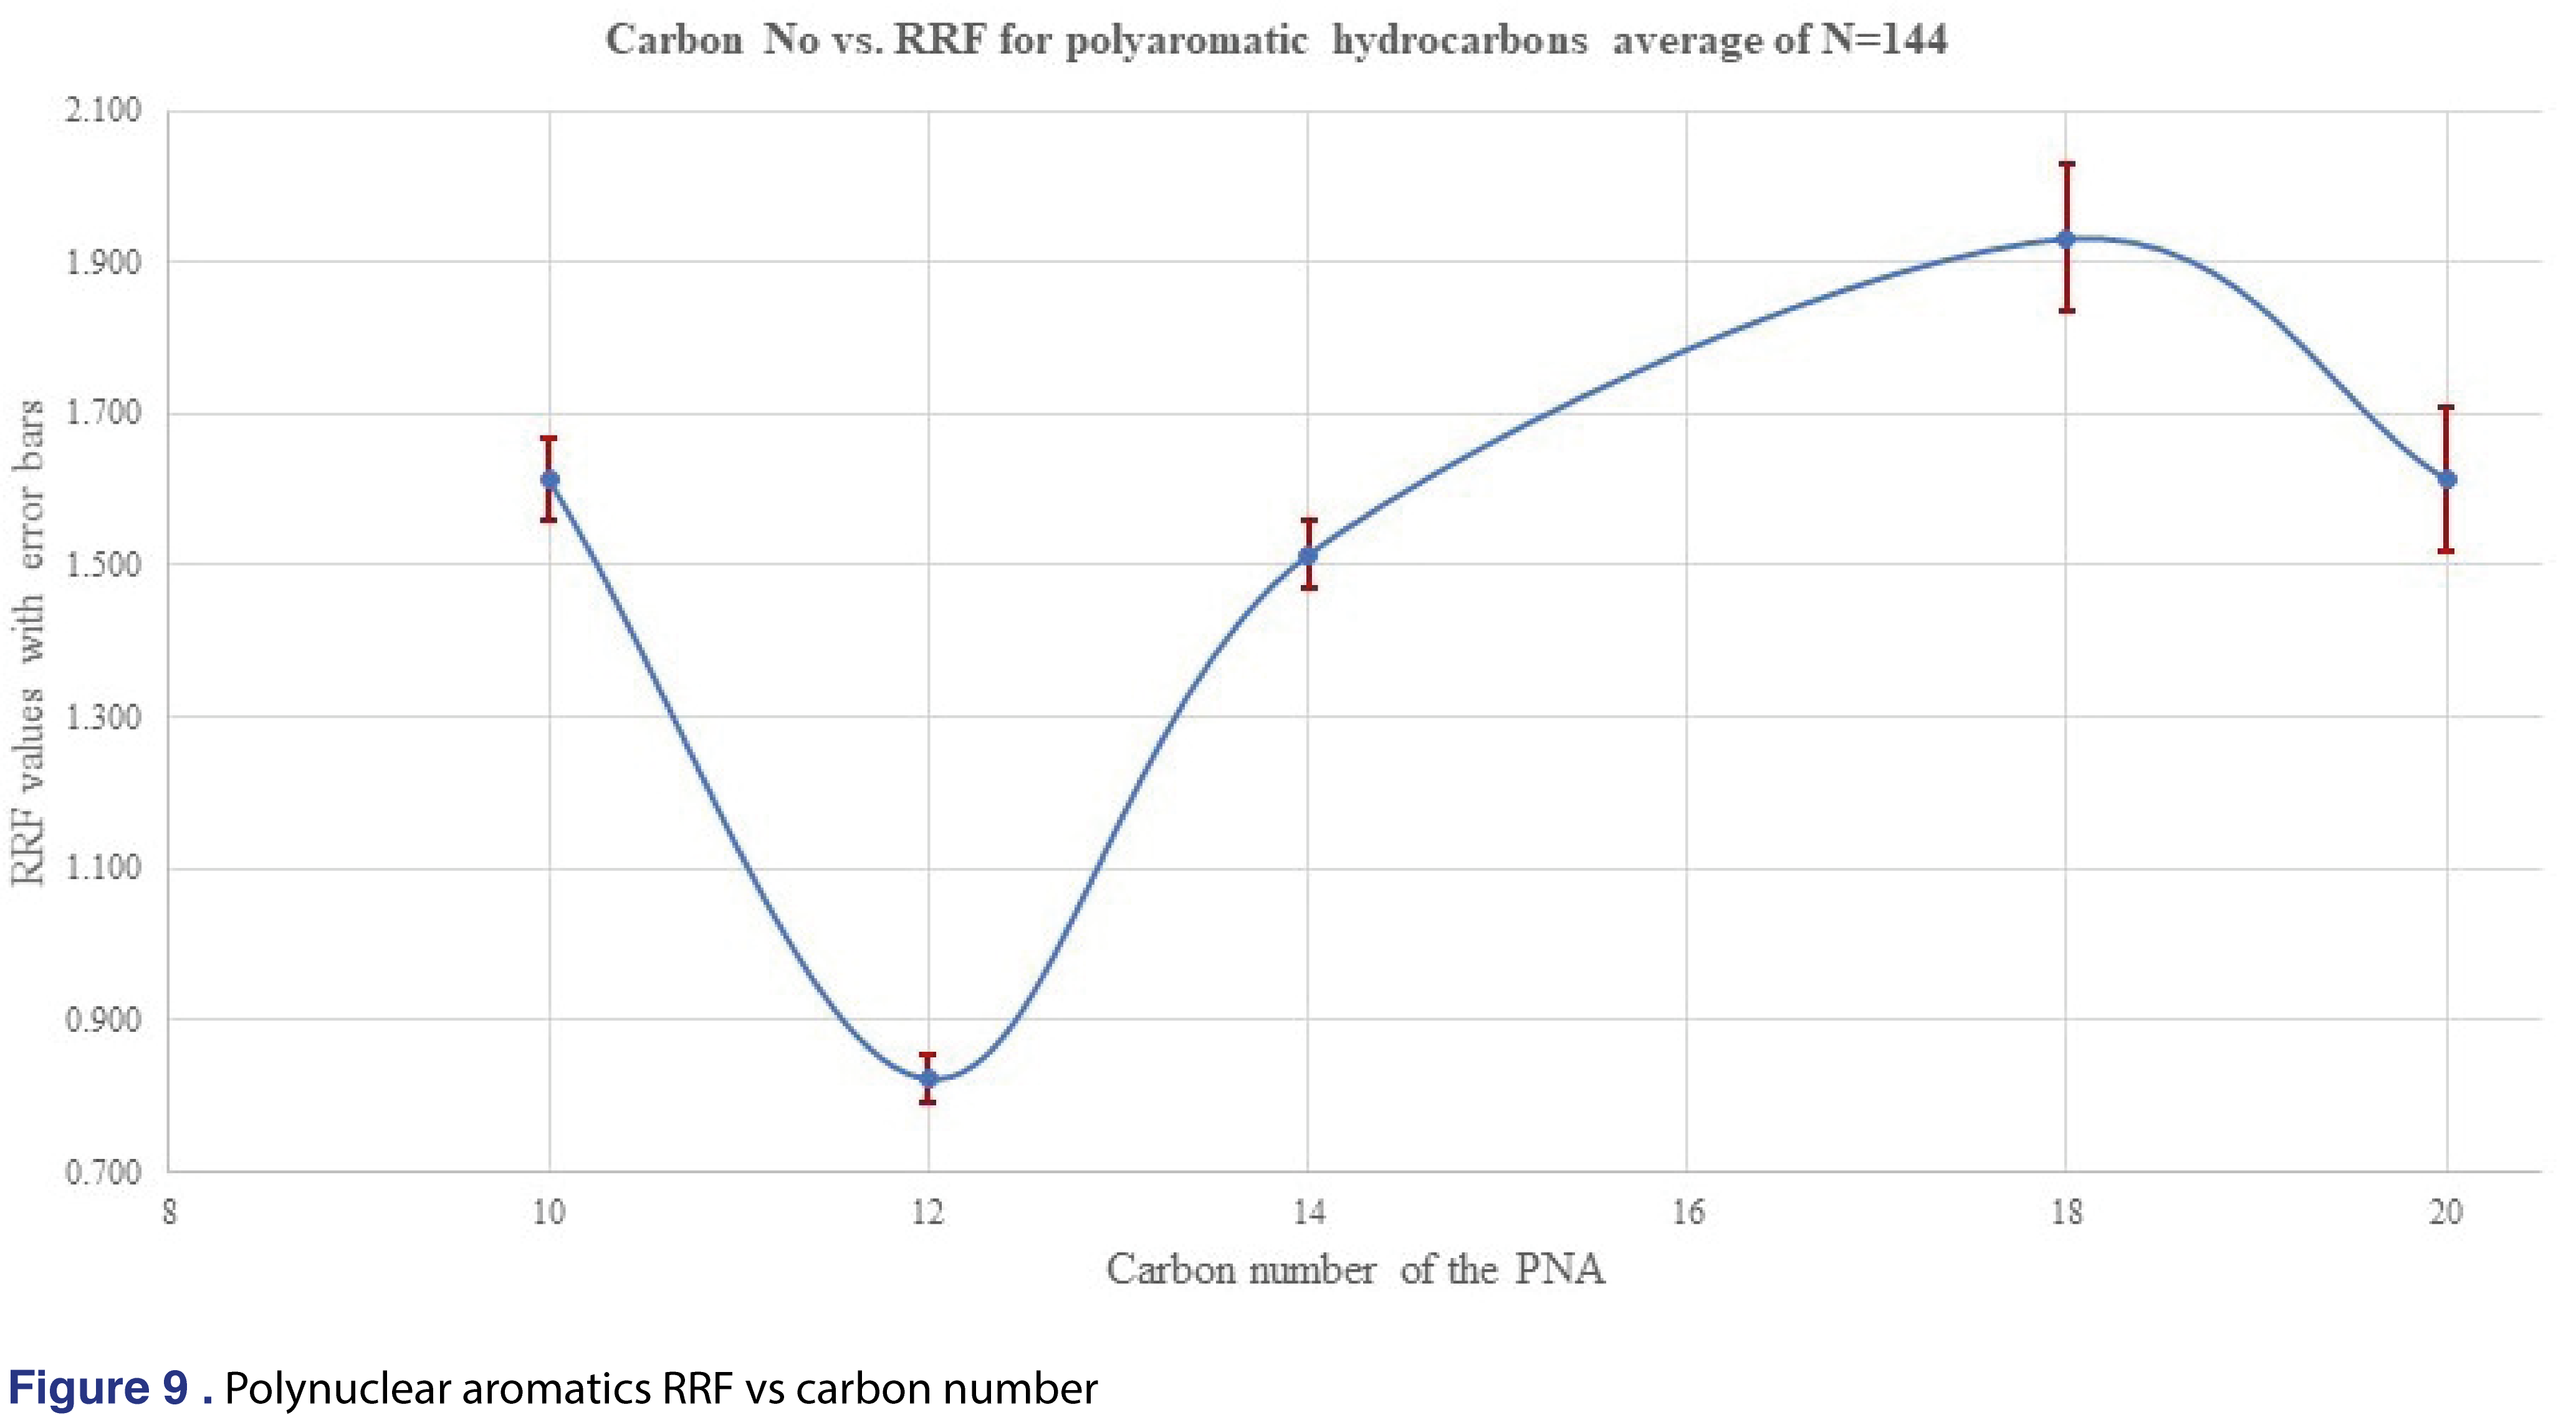
For polynuclear aromatics the RRF showed a huge “response-dip” for the acenaphthene (3-ring system with 12 carbons) as presented in Figure 9. This phenomenon was consistent with all of the solvents and all concentration levels, therefore it is very hard to confirm if we can make a prediction for the different substituted polynuclear aromatic systems. The only alkyl-substituted polyaromatic analyte was the methyl-naphthalene which has an average response factor of 0.897, similar to the C12 acenaphthene.
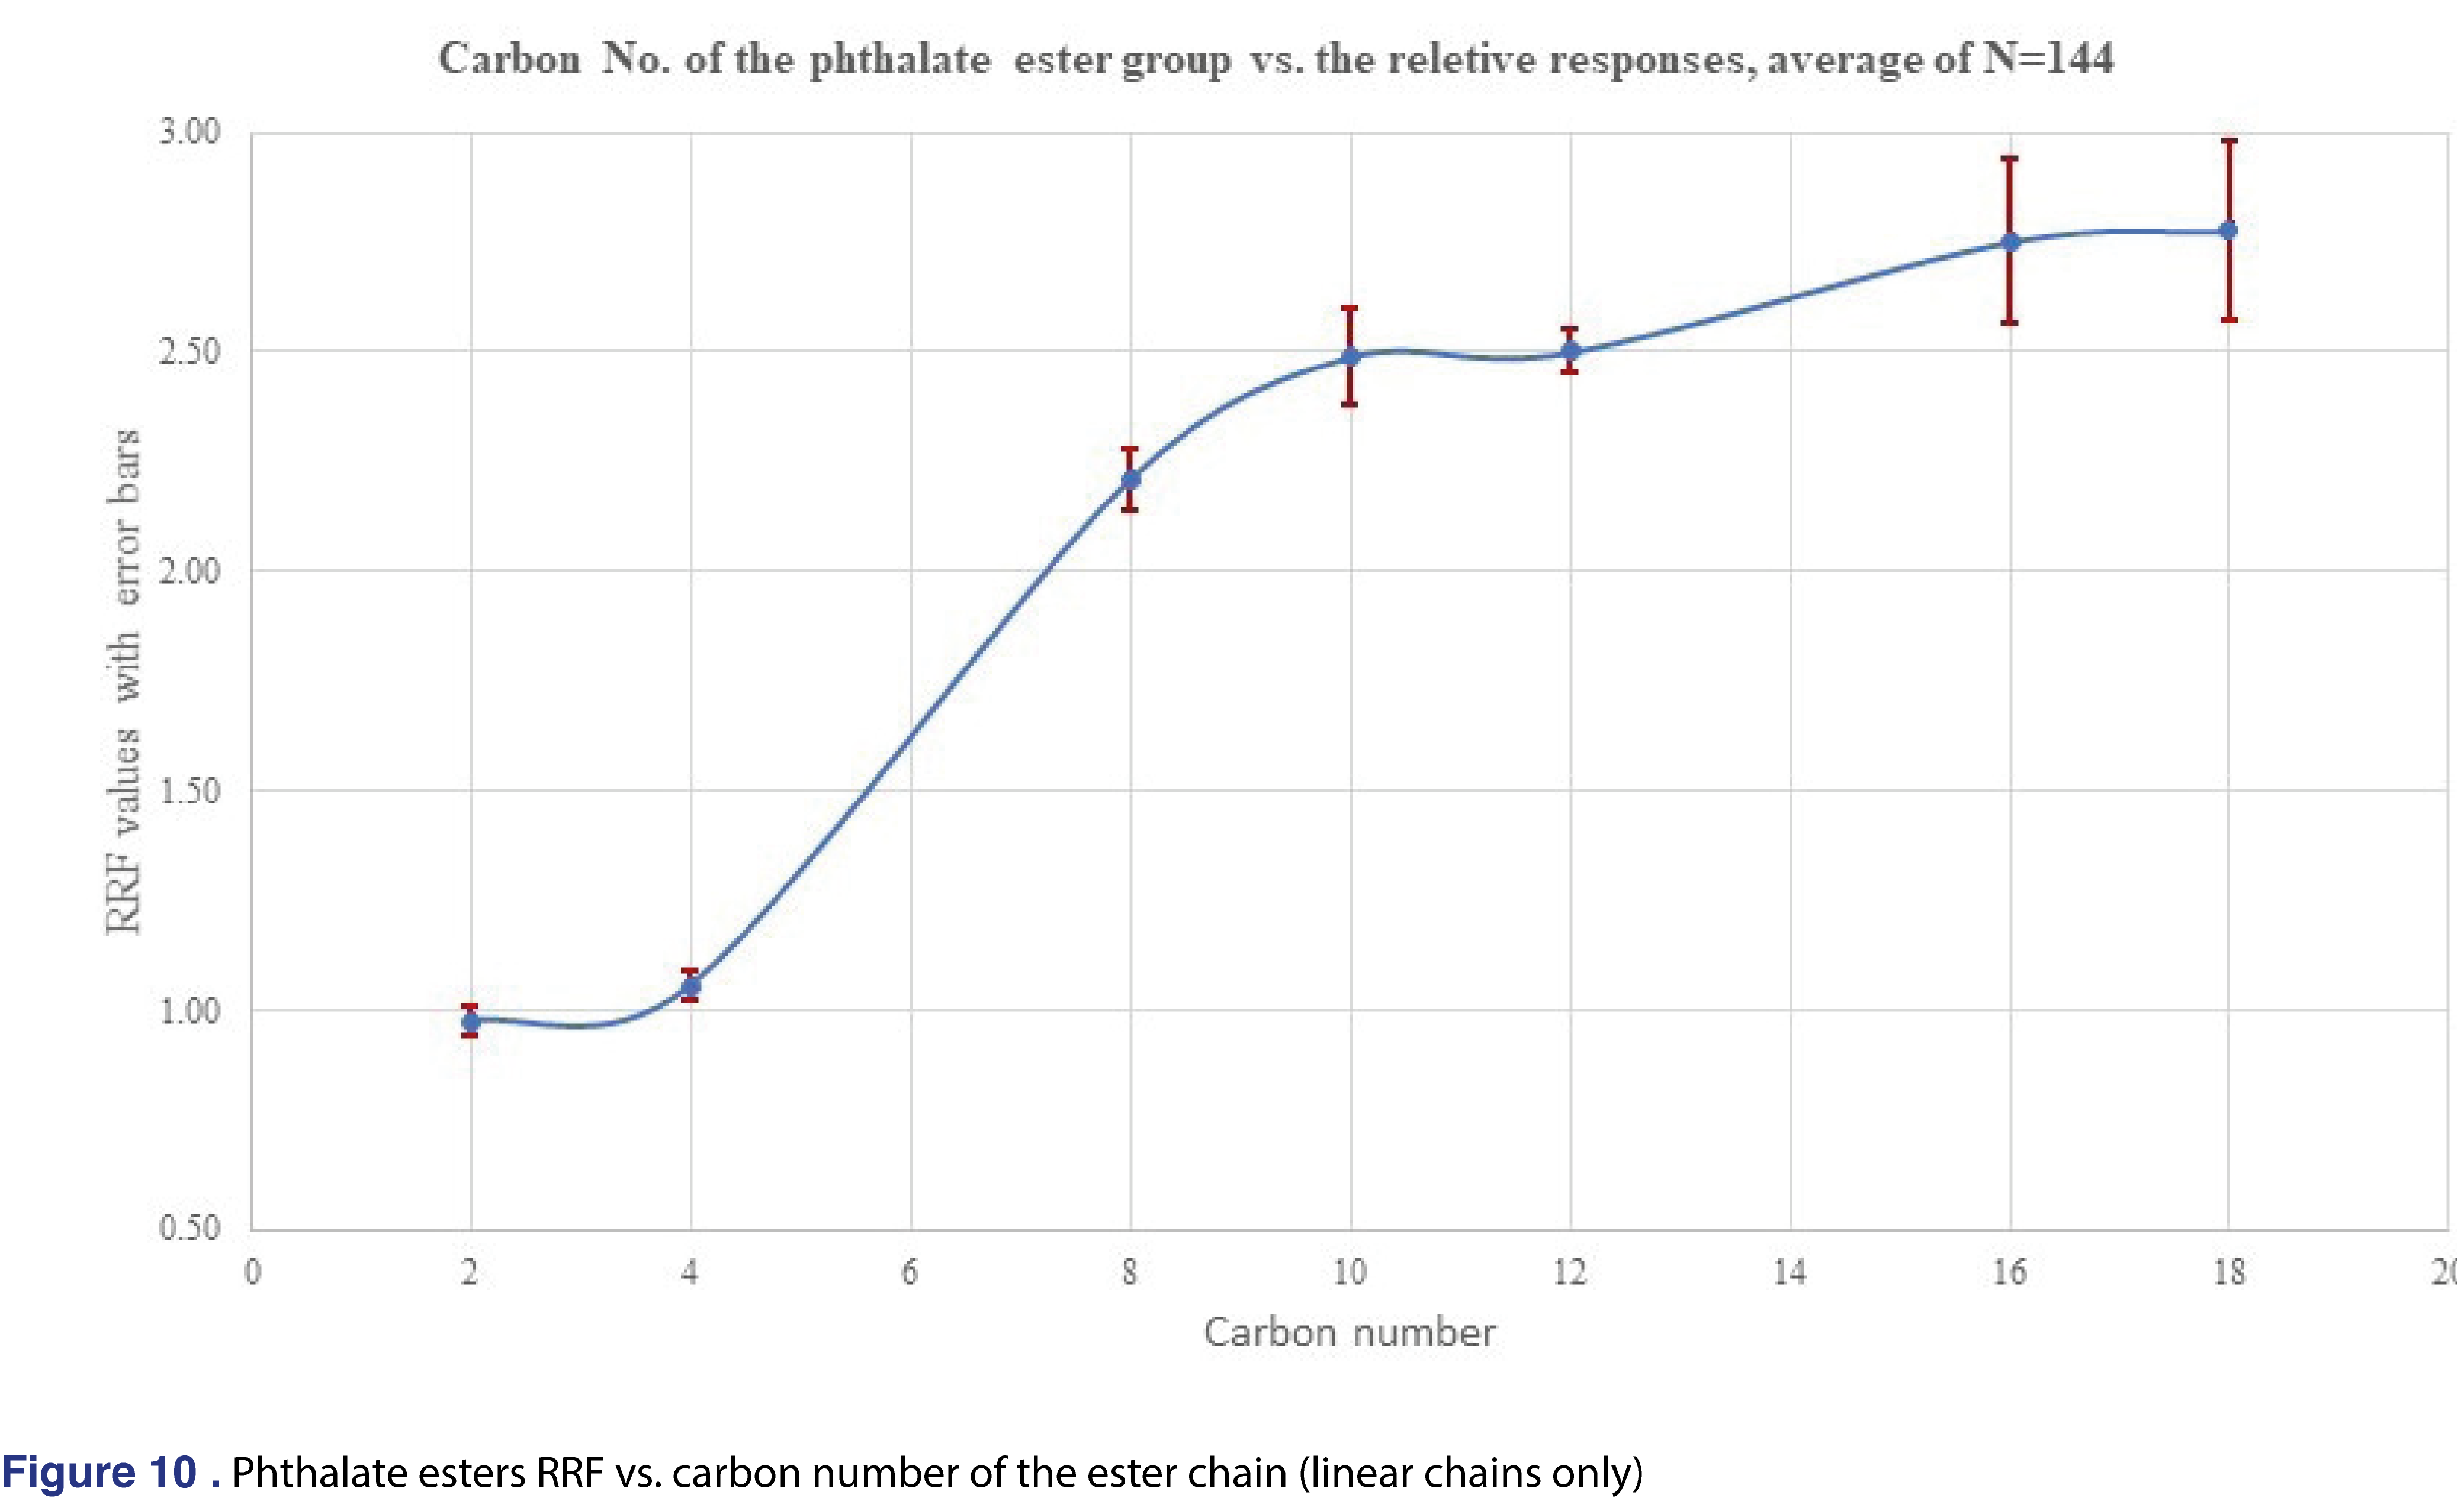
For phthalate esters the relative response plateaued after C10 (dipentyl) ester and shows relatively constant values until C18 (dinonyl), phthalate. There were few non-linear chain esters in the study listed in Table 1 and their response were observed lower than the correspondent linear alkyl versions. For example, the RRF for the Bis(4-methyl-2-pentyl) phthalate is 1.024, less than half than the corresponding di-n-hexyl phthalate RRF of 2.501. However, the trend is opposite for the DEHP, and di-octyl phthalate pairs, as the DEHP has an average response of 3.986 which is much higher value than the di-octyl phthalate of 2.751. As this limited data set shows, trending or predicting RRF values even for chemically similar species is a very challenging task.
4.0. Conclusion
Impact of the different solvent vehicles were evaluated for the relative response factors of common extractables and some model chemicals at 3 different evaluation levels. Altogether 10,656 data points were generated and evaluated (N=1332 data points for each solvent). Based on this limited data set, we can conclude that injection vehicles impact the quality of the response factor databases. As for solvents such as IPA, toluene, ethanol, and isooctane, the standard deviation of the database records is very high, therefore those databases cannot be used for AET correction. For the rest of the solvents, the UF of the databases were between 1.924-2.498, therefore it is scientifically justified if they were used for the purpose of AET level adjustment. The evaluation levels in this study were much lower than for other reported studies, therefore they can provide quantitative assignment for extracts with low-level target concentrations.
Based on the presented data we can conclude that the RRF databases need to be used with scientific justification, as the selection of the injection vehicle has an impact on the database average response value and impacts the number of low responding records and RSD of the database.
6.0 References
- 21 CFR 211, subpart G; Packaging and labeling control. Available at https://www.accessdata.fda.gov/scripts/cdrh/cfdocs/cfcfr/CFRSearch.cfm?CFRPart=211&showFR=1&subpartNode=21:4.0.1.1.11.7
- ISO 10993-18:2020(E), Biological evaluation of medical devices —Part 18: Chemical characterization of medical device materials within a risk management process
- ICH Topic Q3 B (R3) Impurities in New Drug Products, June 2006 CPMP/ICH/2738/99. Available at https://www.fda.gov/media/71733/download
- Vas G, Alquier L, Maryanoff CM, Cohen J, Reed G. Investigation of mass-balance issue in e-beam sterilized paclitaxel eluting coronary stents by SPME/GC–MS. J Pharm Biomed 48, 568–572 (2008). https://doi.org/10.1016/j.jpba.2008.05.031
- Sawant A. Preliminary results of a PDA task force examining the cause, prevention and management of TBA and TCA taints, in: 2011 PDA/FDA Pharmaceutical Supply Chain Conference, June (2011).
- SJN-DO WL Response McNeil Las Piedras PR 2-5-2010. Available at https://www.fda.gov/media/78513/download
- International Council for Harmonisation of Technical Requirements for Pharmaceuticals for Human Use (ICH) Assessment and Control of DNA Reactive (Mutagenic) Impurities in Pharmaceuticals to Limit Potential Carcinogenic Risk M7(R1) Current Step 4 version (2017). Available at https://database.ich.org/sites/default/files/M7_R1_Guideline.pdf
- Guidance for Industry Container Closure Systems for Packaging Human Drugs and Biologic, FDA CBER, FDA CDER (1999). Available at https://www.fda.gov/media/70788/download
- United States Pharmacopeia General Chapter <1663> Assessment of Extractables Associated with Pharmaceutical Packaging/Delivery Systems, USP 43-NF 38 Currently Official on 28-Sep-2021 <1664>, <661>, <663>
- PQRI Safety Thresholds and Best Practices for Extractables and Leachables in Orally Inhaled and Nasal Drug Products (2006). Available at https://pqri.org/wp-content/uploads/2015/08/pdf/LE_Recommendations_to_FDA_09-29-06.pdf
- Q2 (R1) Validation of Analytical Procedures: Text and Methodology, CPMP/ICH/381/95 (1995). Available at https://database.ich.org/sites/default/files/Q2%28R1%29%20Guideline.pdf
- Ermer J. J. H. Miller, Method Validation in Pharmaceutical Analysis Wiley, 1st edition (2005). https://doi.org/10.1002/3527604685.ch1
- Jenke D. Compatibility of Pharmaceutical Products and Contact Materials. John Wiley and Sons, Hoboken NJ (2009). https://doi.org/10.1002/9780470459416
- Ball DJ, Norwood DL, Stults CLM, Nagao LM. Leachables and Extractables Handbook, John Wiley and Sons, Hoboken NJ (2012). https://doi.org/10.1002/9781118147672
- Jenke D, Christiaens P, Verlinde P, Baeten J, Beusen JM. Is Retention Time and/or Structure Matching a Solution to the Challenge of Providing Quantitative Data when Screening for Extractables and Leachables by GC/MS. PDA J Pharm Sci Technol (2021). In press https://doi.org/10.5731/pdajpst.2021.012673
- Christiaens P, Beusen JM, Verlinde P, Baeten J, Jenke D. Identifying and Mitigating Errors in Screening for Organic Extractables and Leachables: Part 1—Introduction to Errors in Chromatographic Screening for Organic Extractables and Leachables and Discussion of the Errors of Omission. PDA J Pharm Sci Tech 74(1), 90-107 (2020). https://doi.org/10.5731/pdajpst.2018.009761
- Christiaens P, Beusen JM, Verlinde P, Baeten J, Jenke D. Identifying and Mitigating Errors in Screening for Organic Extractables and Leachables: Part 2—Errors of Inexact Identification and Inaccurate Quantitation PDA J Pharm Sci Tech January 74(1), 108-133 (2020). https://doi.org/10.5731/pdajpst.2018.009779
- Jenke D. Correcting the Analytical Evaluation Threshold (AET) and Reported Extractable’s Concentrations for Analytical Response Factor Uncertainty Associated with Chromatographic Screening for Extractables/Leachables. PDA J Pharm Sci Tech 74(3), 348-358 (2020). https://doi.org/10.5731/pdajpst.2019.010520
- Jordi MA et al. Reducing relative response factor variation using a multi detector approach for extractables and leachables (E&L) analysis to mitigate the need for uncertainty factors. J Pharm and Biomed (186), 113334 (2020). https://doi.org/10.1016/j.jpba.2020.113334
- Vas G, Fleck L, Michelson A, Dunn N, Duett J, Cali J. Importance of a High Performing GC-MS Based Screening Method for Testing Stability Samples for Volatile and Semi- Volatile Leachable Impurities. Rev Sep Sci 3(1), 3-20 (2021). https://doi.org/10.17145/rss.21.002
- Jennings W, Mehran MF. Sample Injection in Gas Chromatography, J Chrom Sci 24(1), 34-40 (1986). https://doi.org/10.1093/chromsci/24.1.34
- Basics and Fundamentals of Gas Chromatography, Application e-book by Shimadzu (2020). Available at https://www.shimadzu.eu.com/sites/shimadzu.seg/files/SEG/c10ge082-GC-Basics-and-Fundamentals.pdf
- Agilent Technologies, GC Inlets. Agilent Corporation 2005 2nd edition. Available at https://www.agilent.com/cs/library/usermanuals/public/5958-9468_041007.pdf
- Bonn J. Improved Techniques for Sampling and Sample Introduction in Gas Chromatography. Ph.D. Thesis, Royal Institute of Technology, Division of Analytical Chemistry, Stockholm, Sweden (2008).
- Vas G, Fleck L, Carpenter H, Huang JT. Evaluation of Relative Response Factors for Multiple Common Extractable Chemicals. Smithers Rapra, Extractables and Leachables Conference, Bethesda, Maryland, May 7-9 (2018).
- Sinott M., Water Injection: An Expanding Problem. Webinar by Agilent (2019). Available at https://www.agilent.com/cs/library/slidepresentation/public/agilent-water-injections-in-gc-webinar-august222019.pdf
- Jenke D, Odufu A. Utilization of Internal Standard Response Factors to Estimate the Concentration of Organic Compounds Leached from Pharmaceutical Packaging Systems and Application of Such Estimated Concentrations to Safety Assessment. J Chrom Sci 50, 206–212 (2012). https://doi.org/10.1093/chromsci/bmr048
- Zdravkovic S A, Duong CT, Hellenbrand AA, Duff SR, Dreger AL. Establishment of a reference standard database for use in the qualitative and semi-quantitative analysis of pharmaceutical contact materials within an extractables survey by GC–MS. J of Pharm and Biomed 151, 49–60 (2018). https://doi.org/10.1016/j.jpba.2017.12.054
- Li K, Cardoen D. Transformation of Toxicology Data into Specific PDE’s. Biopharma Asia Webinar (2020). Available at https://biopharma-asia.com/webinars/transformation-of-toxicology-data-into-specific-pdes/
- Jenke D, Christiaens P, Beusen JM, Verlinde P, Baeten J. A Practical Derivation of the Uncertainty Factor Applied to Adjust the Extractables/Leachables Analytical Evaluation Threshold (AET) for Response Factor Variation. PDA J Pharm Sci Technol (2021). In press https://doi.org/10.5731/pdajpst.2021.012692
- de Saint Laumer JY et al. Prediction of response factors for gas chromatography with flame ionization detection: Algorithm improvement, extension to silylated compounds, and application to the quantification of metabolites. J Sep Sci 38, 3209–3217 (2015). https://doi.org/10.1002/jssc.201500106
All site content, except where otherwise noted, is licensed under a Creative Commons Attribution 4.0 License